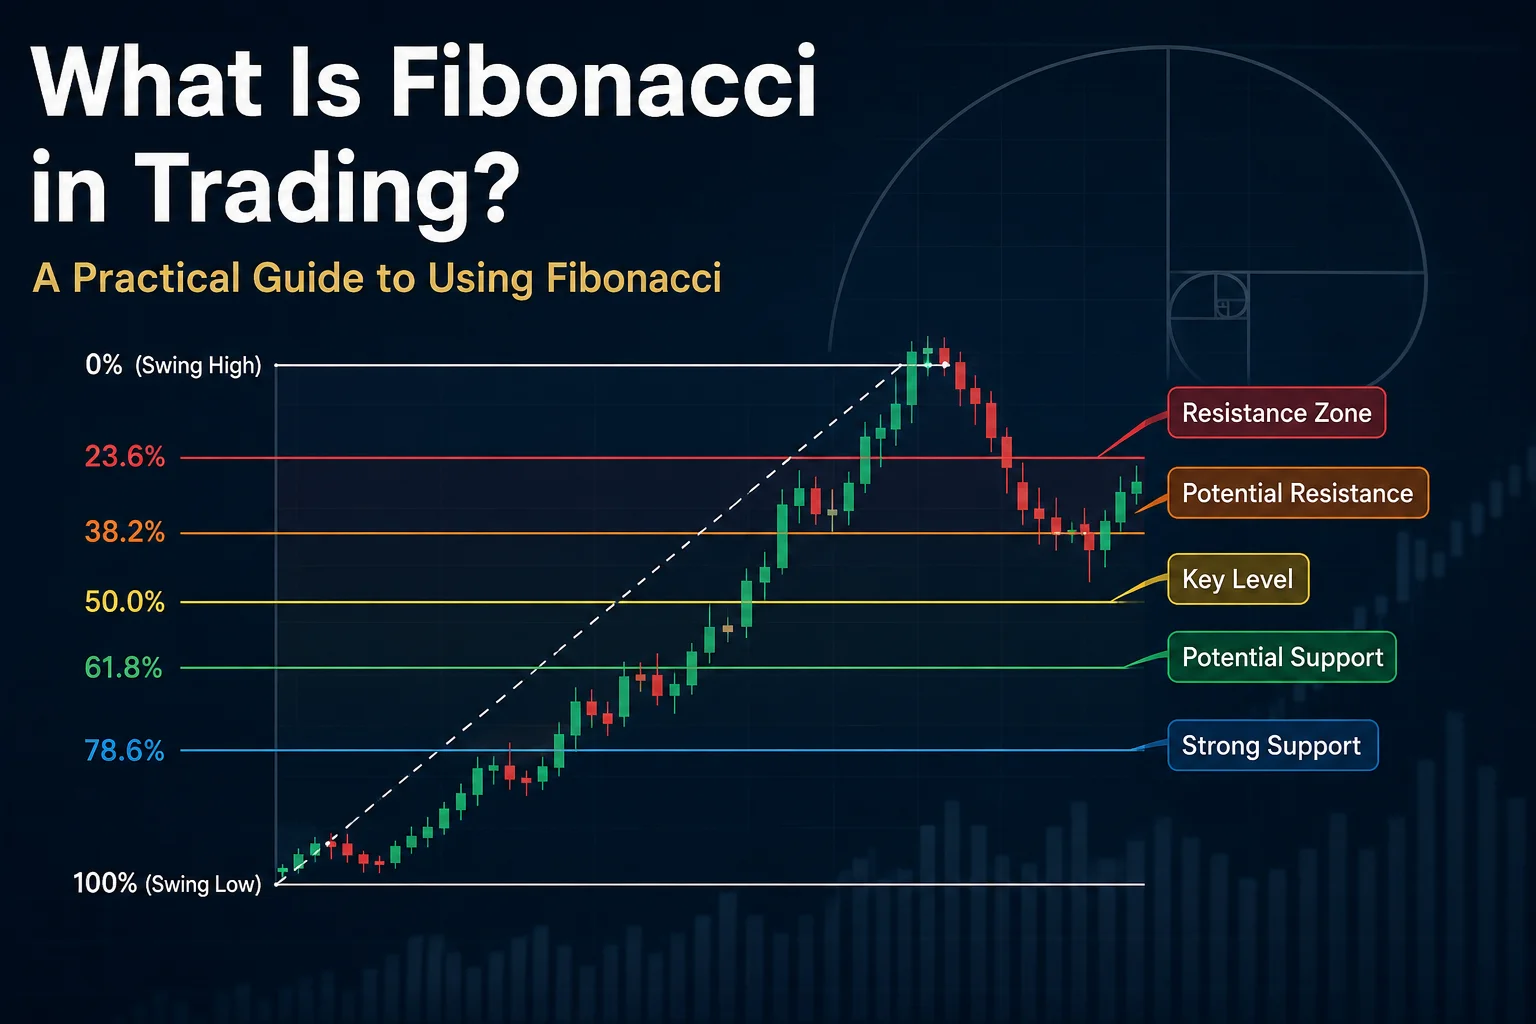
What Is Fibonacci in Trading?
What Is Fibonacci in Trading? A Practical Guide to Using Fibonacci
Fibonacci is one of the most widely used concepts in technical analysis. Open almost any professional charting platform and you will find Fibonacci tools sitting alongside trend lines, moving averages, support and resistance tools, and technical indicators. Traders use these levels in Forex, cryptocurrency, stocks, commodities, and other financial markets to identify areas where price may react.
But there is an important distinction to make from the beginning: Fibonacci is not a tool that predicts the future with certainty.
A Fibonacci level does not mean that price must reverse at a particular point. Instead, traders use Fibonacci ratios to identify potential zones of support, resistance, pullbacks, continuation, and profit targets. These zones can then be evaluated alongside market structure, price action, volume, trend direction, and other forms of confirmation.
For example, imagine that EUR/USD makes a strong bullish move and then begins to pull back. A trader may use the Fibonacci Retracement tool to measure the previous upward swing. If the correction approaches the 61.8% retracement level while also reaching a previous support area, that zone may deserve closer attention.
The same principle can be applied to Bitcoin, Ethereum, stock indices, commodities, and many other tradable assets.
This guide explains what Fibonacci is, where its famous ratios come from, how Fibonacci Retracement works, which levels traders commonly monitor, and how to begin applying the tool correctly rather than treating every Fibonacci line as an automatic trading signal.
Risk note: Fibonacci analysis does not guarantee profitable trades. Forex and cryptocurrency trading involve substantial risk, and technical tools should be used alongside appropriate risk management.
What Is Fibonacci in Trading?
In trading, Fibonacci generally refers to a group of technical analysis tools based on ratios derived from the Fibonacci number sequence.
The classic sequence begins like this:
0, 1, 1, 2, 3, 5, 8, 13, 21, 34, 55, 89, 144…
After the first numbers, each new number is created by adding the previous two numbers together.
For example:
- 5 + 8 = 13
- 8 + 13 = 21
- 13 + 21 = 34
- 21 + 34 = 55
- 34 + 55 = 89
The sequence itself is interesting, but traders are generally more interested in the ratios associated with it.
When relationships between numbers in the sequence are examined, several percentages emerge that have become popular in technical analysis. These include:
- 23.6%
- 38.2%
- 50%
- 61.8%
- 78.6%
You may also encounter extension levels such as:
- 127.2%
- 161.8%
- 261.8%
Among these numbers, 61.8% is particularly famous because it is related to the golden ratio.
However, traders should understand that financial markets are not mechanically controlled by mathematical ratios. Fibonacci levels are better viewed as reference areas that may help organize price analysis.
Why Do Traders Use Fibonacci?
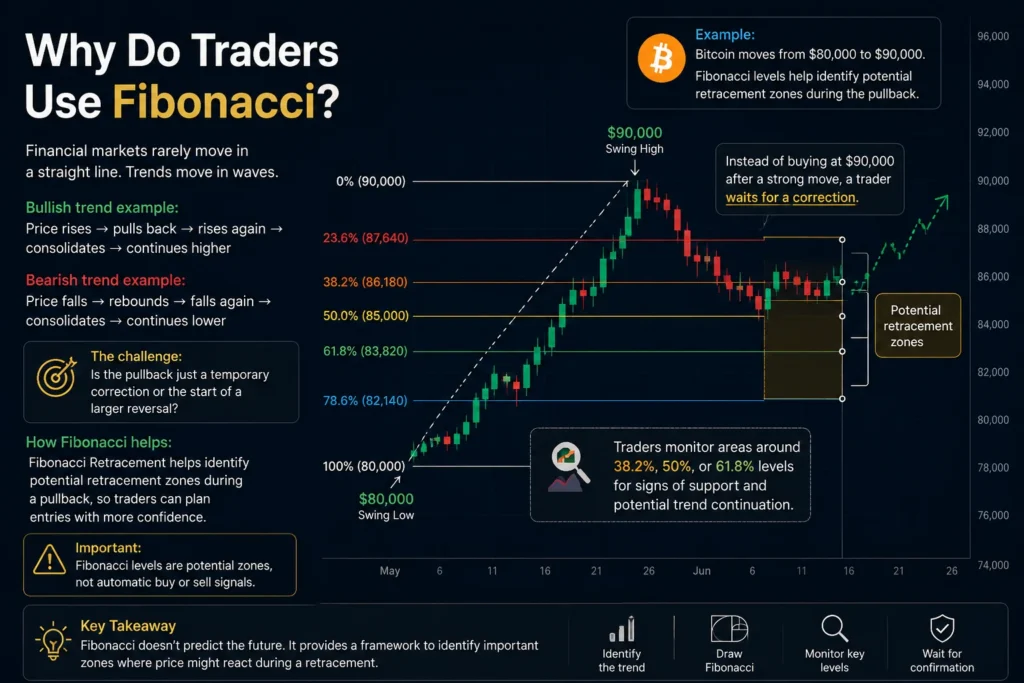
Financial markets rarely move in a perfectly straight line.
A bullish trend, for example, may look something like this:
Price rises → pulls back → rises again → consolidates → continues higher
A bearish trend may follow the opposite pattern:
Price falls → rebounds → falls again → consolidates → continues lower
These temporary moves against the dominant direction are commonly called retracements or pullbacks.
One of the main challenges for a trader is deciding whether a pullback is simply a temporary correction or the beginning of a larger reversal.
Fibonacci Retracement helps create a framework for analyzing that question.
Suppose Bitcoin moves from $80,000 to $90,000.
Rather than buying immediately at $90,000 after a strong move, a trader may wait for a correction. Fibonacci levels can be drawn across the $80,000–$90,000 swing to identify potential retracement zones.
The trader might then monitor areas around the 38.2%, 50%, or 61.8% levels.
This does not mean the trader should automatically buy when price touches one of them.
Instead, the trader might ask:
- Is the broader trend still bullish?
- Is there historical support near the Fibonacci level?
- Has price formed a rejection candle?
- Has market structure remained intact?
- Is momentum supporting continuation?
- Is the potential reward worth the risk?
- Where would the trade idea become invalid?
This is a much more disciplined use of Fibonacci.
What Is Fibonacci Retracement?
Fibonacci Retracement is probably the most familiar Fibonacci tool in technical analysis.
It is designed to measure how far price has retraced relative to a previous directional move.
To use it, a trader first identifies a meaningful price swing.
In a bullish market, this generally means selecting:
Swing Low → Swing High
In a bearish market:
Swing High → Swing Low
The charting platform then automatically displays several percentage levels between those two points.
For example, imagine a currency pair rises from 1.1000 to 1.1200.
The total move is:
1.1200 − 1.1000 = 0.0200
That is a 200-pip move for a typical four-decimal Forex quote.
A 50% retracement would represent approximately half of that move:
0.0200 × 50% = 0.0100
A potential 50% retracement price would therefore be around:
1.1200 − 0.0100 = 1.1100
A trader could monitor the area around 1.1100 to see how buyers and sellers behave there.
Again, 1.1100 is not automatically a buy signal. It is simply a technically relevant area created by measuring the previous price swing.
The Most Important Fibonacci Levels
Different traders configure their Fibonacci tools differently, but several retracement levels appear frequently.
23.6% Fibonacci Level
A 23.6% retracement represents a relatively shallow correction.
In a strong trend, price may retrace only a small portion of the previous move before continuing in the original direction.
For that reason, a reaction around 23.6% can sometimes appear during markets with strong momentum.
However, shallow pullbacks can create a practical problem: entering too aggressively may leave little room for confirmation.
A trader should avoid assuming that a strong trend will always produce a shallow correction.
38.2% Fibonacci Level
The 38.2% level is commonly monitored during moderate pullbacks.
Suppose Ethereum rallies strongly and then begins correcting. If the correction reaches 38.2% of the previous upward swing, traders may examine that area for signs that demand is returning.
The level becomes more interesting when it overlaps with another technical feature.
For example:
38.2% Fibonacci + previous resistance turned support + bullish rejection
This combination may carry more analytical significance than a 38.2% line appearing alone in the middle of an otherwise unimportant price zone.
This concept is known as confluence.
Why the 50% Level Appears on Fibonacci Tools
There is an interesting detail about the 50% retracement.
Strictly speaking, 50% is not a Fibonacci ratio derived from the classic sequence in the same way as 38.2% or 61.8%.
Nevertheless, it is included in many Fibonacci Retracement tools because traders have historically paid considerable attention to the midpoint of price movements.
Think about a market that rises from $100 to $120.
The midpoint is:
$110
If price later returns to $110, the market has given back half of the previous advance.
This can be psychologically and technically meaningful, especially if the midpoint overlaps with previous market structure.
Therefore, although the 50% level is not technically a Fibonacci ratio, it has become deeply integrated into Fibonacci-based trading analysis.
Why Is 61.8% So Important?
The 61.8% Fibonacci retracement is arguably the best-known level associated with Fibonacci trading.
It is closely related to the golden ratio, approximately 1.618.
In trading practice, the 61.8% retracement represents a relatively deep pullback.
Imagine that an asset rises from $200 to $300 and then begins correcting.
The size of the original move is:
$300 − $200 = $100
A 61.8% correction of that move equals:
$100 × 0.618 = $61.80
Measured down from the swing high:
$300 − $61.80 = $238.20
Therefore, the 61.8% retracement would be around $238.20.
Does this mean traders should immediately buy at $238.20?
No.
A more professional approach would be to observe what happens around that area.
For instance, a trader could look for:
- Evidence that the previous bullish structure remains valid.
- A rejection of lower prices.
- A nearby support zone.
- Increased buying activity.
- A bullish candlestick formation.
- A favorable risk-to-reward setup.
The Fibonacci level provides the location. Other evidence may provide the reason to act.
That distinction is essential.
Fibonacci Is Better Treated as a Zone, Not an Exact Price
One of the most common beginner mistakes is treating Fibonacci levels as exact numbers.
Suppose the 61.8% retracement is located at 1.0854.
A beginner might expect price to touch exactly 1.0854 and reverse.
Real markets are rarely that precise.
Price could reverse at:
- 1.0850
- 1.0858
- 1.0845
- or somewhere else nearby.
It could also break through the entire area.
This is why experienced technical traders often think in terms of zones rather than individual lines.
Market orders are generated by thousands or millions of participants. Different brokers can also display slightly different prices depending on their liquidity sources, spreads, and market feeds.
The idea that one exact Fibonacci price must control the entire market is therefore unrealistic.
Instead of thinking:
“Price reached 61.8%, so I must enter.”
A more useful question is:
“Price has entered an important retracement zone. Is the market giving me evidence that the pullback may be ending?”
That change in mindset can significantly improve how Fibonacci is used.
How to Draw Fibonacci Retracement Correctly
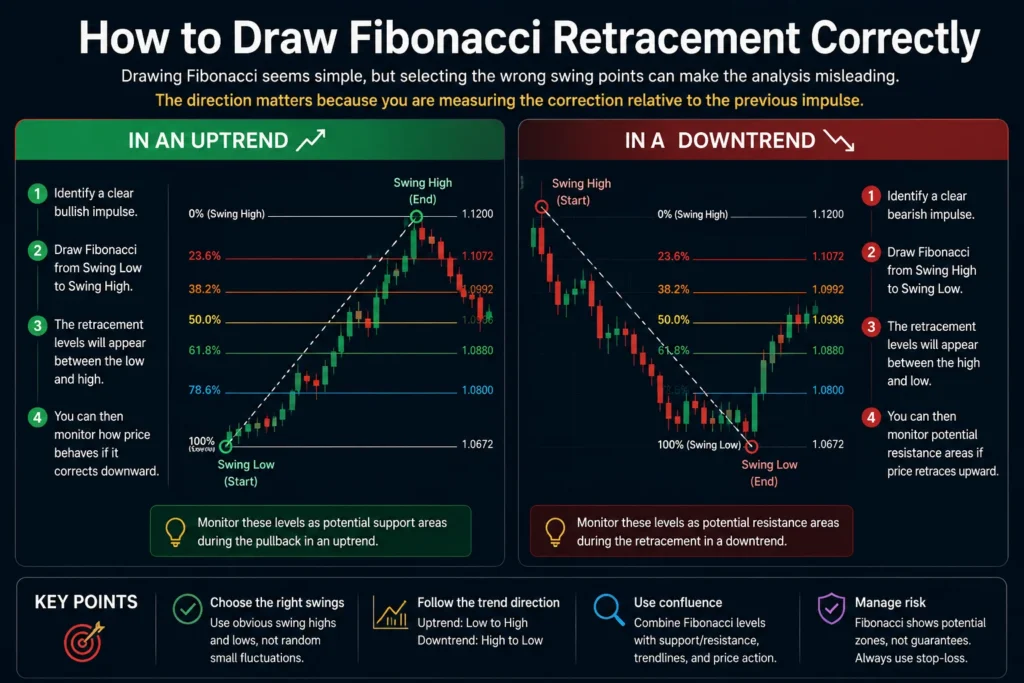
Drawing Fibonacci seems simple, but selecting the wrong swing points can make the analysis misleading.
The basic process is straightforward.
In an Uptrend
Identify a clear bullish impulse.
Then draw Fibonacci from:
Swing Low → Swing High
The retracement levels will appear between the low and high.
You can then monitor how price behaves if it corrects downward.
In a Downtrend
Identify a clear bearish impulse.
Draw from:
Swing High → Swing Low
You can then monitor potential resistance areas if price retraces upward.
The direction matters because you are measuring the correction relative to the previous impulse.
How to Identify a Useful Swing
Not every tiny movement deserves a Fibonacci measurement.
This is especially important on lower timeframes, where charts contain considerable market noise.
A useful swing is usually visually meaningful and connected to the market structure you are analyzing.
For example, consider a four-hour Forex chart.
Price breaks above an established resistance level, accelerates upward, creates a new swing high, and then starts correcting.
That impulsive move may provide a logical Fibonacci measurement.
By contrast, drawing Fibonacci across every small five-minute fluctuation can produce dozens of overlapping levels with little analytical value.
A practical rule is:
Choose a swing that matters to the timeframe and trading setup you are analyzing.
If you are trading the daily chart, daily structure matters.
If you are trading a 15-minute strategy, intraday swings become more relevant.
Consistency is more important than constantly redrawing the tool until you find levels that fit the price action.
Practical Forex Example
Consider a hypothetical EUR/USD setup.
Assume the pair moves from:
1.0800 → 1.1000
The move equals approximately 200 pips.
After reaching 1.1000, price starts declining.
You draw Fibonacci from 1.0800 to 1.1000.
The retracement tool identifies several potential areas between those prices.
Now suppose the 61.8% area also corresponds closely with:
- a previous resistance zone;
- a recently broken market structure level;
- and a rising trend line.
Price enters that region and forms a bullish rejection candle.
This situation is more meaningful than simply saying:
“EUR/USD touched Fibonacci 61.8%, so buy.”
The trade thesis is instead based on multiple observations pointing toward the same area.
That is the principle of confluence.
Practical Cryptocurrency Example
Fibonacci is also widely used by traders analyzing cryptocurrency markets.
Suppose Bitcoin moves from $90,000 to $100,000 and then begins a correction.
A trader measures the $10,000 impulse using Fibonacci Retracement.
Instead of placing a blind buy order at a specific Fibonacci percentage, the trader waits.
Price approaches a retracement zone that previously acted as resistance. Trading activity increases, sellers struggle to push the market lower, and the short-term structure begins turning bullish again.
The Fibonacci measurement has helped identify where to pay attention.
The actual decision still depends on price behavior.
This is particularly important in cryptocurrency because volatility can be high. Price can briefly move beyond technical levels, trigger stop-loss orders, and then reverse sharply.
Therefore, risk management should remain central to the setup.
Does Your Broker Affect Fibonacci Analysis?
A broker does not change the mathematical ratios behind Fibonacci, but the trading environment can affect how your chart and execution behave.
Forex prices can vary slightly between brokers because different providers may use different liquidity sources and spreads.
For example, one broker might display a candle high at 1.10246 while another shows 1.10251.
Usually, this small difference does not invalidate Fibonacci analysis, especially if you treat levels as zones rather than exact prices.
However, traders should still consider factors such as:
- spread;
- slippage;
- execution quality;
- trading commissions;
- price feed quality;
- available charting tools;
- market volatility.
These factors become particularly relevant when a trading strategy uses very tight stop-loss distances.
A technical setup can look excellent on a chart while still producing poor results if transaction costs and execution are ignored.
Fibonacci Should Not Be Used Alone
Perhaps the most important lesson for beginners is that Fibonacci is usually more useful as a supporting tool than as an isolated trading system.
A Fibonacci level by itself tells you very little about what buyers and sellers will actually do next.
Its usefulness can increase when combined with other evidence.
Common forms of confluence include:
- support and resistance;
- market structure;
- trend lines;
- supply and demand zones;
- candlestick behavior;
- moving averages;
- momentum indicators;
- volume analysis;
- previous highs and lows;
- breakout and retest structures.
For example, imagine price reaches the 61.8% Fibonacci level.
Scenario A:
There is no important support nearby, the market structure is bearish, momentum is weak, and price cuts through the level aggressively.
Scenario B:
The 61.8% level overlaps with major daily support, the broader trend remains bullish, and price shows strong rejection from the zone.
Both scenarios involve the same Fibonacci percentage.
Yet their trading context is completely different.
That is why context matters more than the number itself.
Common Beginner Mistakes When Using Fibonacci
Before building a strategy around Fibonacci, it helps to recognize several mistakes that can reduce its usefulness.
Drawing Fibonacci on Every Price Movement
More Fibonacci drawings do not automatically produce better analysis.
Too many measurements can turn a clean chart into a confusing collection of lines.
Focus on meaningful swings.
Entering Immediately When Price Touches a Level
A Fibonacci touch is not confirmation.
Waiting for price action or another form of confirmation can help distinguish between a possible reaction and a strong breakout through the level.
Ignoring the Higher-Timeframe Trend
A Fibonacci setup on a five-minute chart may look attractive while the four-hour or daily market structure points strongly in the opposite direction.
Always understand the broader context.
Moving Swing Points to Make Fibonacci “Work”
This creates confirmation bias.
If you repeatedly adjust the tool until one of the ratios matches a reversal that has already occurred, you are no longer objectively analyzing the market.
Define consistent rules for choosing swing highs and lows.
Ignoring Risk Management
Even an excellent technical setup can fail.
Professional trading is not about finding a tool that never loses. It is about managing uncertainty.
Before entering a position, traders should know:
- where the setup becomes invalid;
- how much capital they are willing to risk;
- where the stop-loss may be placed;
- what potential target exists;
- whether the expected reward justifies the risk.
The Core Principle to Remember
Fibonacci should not be thought of as a magical forecasting system.
Its real value is much simpler.
It gives traders a structured way to measure price movements and identify areas where a pullback or extension may deserve attention.
The basic workflow can be summarized as:
- Identify the broader market direction.
- Find a meaningful impulse swing.
- Draw Fibonacci from the appropriate swing low to high or high to low.
- Identify important retracement levels.
- Look for confluence with market structure.
- Wait for evidence from price action.
- Define invalidation and risk before entering.
- Execute only when the setup meets your trading rules.
Once this foundation is understood, Fibonacci becomes far more useful.
Using Fibonacci in Real Trading Strategies
Understanding the mathematics behind Fibonacci is useful, but traders ultimately need to know how to apply it in real market conditions. Drawing several retracement lines on a chart is easy. Deciding which swing matters, which level deserves attention, where a trade becomes invalid, and whether the potential reward justifies the risk requires much more thought.
This is especially important in Forex and cryptocurrency markets, where volatility can cause price to move rapidly through technical levels. A Fibonacci level that looks perfect on a historical chart may fail completely in live trading.
For that reason, Fibonacci should be incorporated into a structured trading process rather than used as a standalone buy-or-sell indicator.
A practical approach usually involves four elements:
- Market direction
- A meaningful price swing
- Fibonacci confluence
- Trade confirmation and risk management
In this section, we will examine each of these elements and build several practical Fibonacci strategies that beginners and intermediate traders can test and refine.
How to Build a Fibonacci Trading Setup
Before looking for an entry, start with the market itself.
One of the biggest mistakes traders make is opening the Fibonacci Retracement tool first and then searching for a trade that fits the levels.
The process should usually be reversed.
First analyze the market. Then use Fibonacci to measure a relevant move.
Step 1: Determine the Market Trend
Start by asking a simple question:
Is the market trending upward, trending downward, or moving sideways?
In a basic bullish structure, price tends to form:
Higher Highs (HH) + Higher Lows (HL)
In a bearish structure, price tends to form:
Lower Highs (LH) + Lower Lows (LL)
Consider a simplified bullish structure:
100 → 115 → 108 → 125 → 117 → 135
Although price experiences corrections, the general direction remains upward because new highs and higher lows continue to develop.
In such an environment, many traders prefer to search for buying opportunities during corrections rather than repeatedly attempting to short the trend.
Fibonacci can help measure those corrections.
The opposite principle applies to a bearish trend.
Fibonacci Trading Strategy for an Uptrend
Suppose a Forex pair has been moving upward.
Price makes a strong move from 1.2500 to 1.2900.
Rather than buying at 1.2900 after a significant rally, you decide to wait for a pullback.
You draw Fibonacci:
Swing Low: 1.2500
Swing High: 1.2900
The size of the move is:
1.2900 − 1.2500 = 0.0400
Now you monitor the retracement.
Price begins falling from 1.2900.
It passes the 23.6% retracement and eventually approaches the region between the 50% and 61.8% levels.
At this point, you still do not have an automatic buy signal.
Instead, you examine the surrounding market structure.
Suppose the area also contains a previous resistance level at approximately 1.2670 that has recently been broken.
That creates an interesting situation:
Previous resistance + Fibonacci retracement + bullish trend
If price enters the area and begins showing evidence of buying pressure, the setup becomes more interesting.
Possible confirmation could include:
- bullish rejection candles;
- a bullish engulfing pattern;
- failure to create a new lower low;
- a break of short-term bearish structure;
- increasing buying momentum;
- a retest of the Fibonacci zone followed by rejection.
This approach gives Fibonacci a specific role.
It identifies the area of interest, while price action helps determine whether there is a reasonable trade.
Fibonacci Trading Strategy for a Downtrend
The same logic can be reversed.
Imagine GBP/USD falls from:
1.3100 → 1.2700
The market is already showing a bearish structure.
You draw Fibonacci from:
Swing High: 1.3100
to
Swing Low: 1.2700
Price then begins recovering.
A beginner might see the recovery and assume a new bullish trend has started.
A more patient trader may interpret it as a potential retracement within the broader downtrend.
Suppose price approaches the 61.8% retracement area and that area also corresponds with previous support that has now become resistance.
The trader now has several pieces of information:
- the broader trend is bearish;
- price is retracing upward;
- the Fibonacci level is approaching;
- previous support may act as resistance;
- the previous bearish structure has not yet been invalidated.
If sellers begin taking control again around the area, a short setup may become possible.
Notice the language here: possible, not guaranteed.
Technical analysis deals in probabilities rather than certainty.
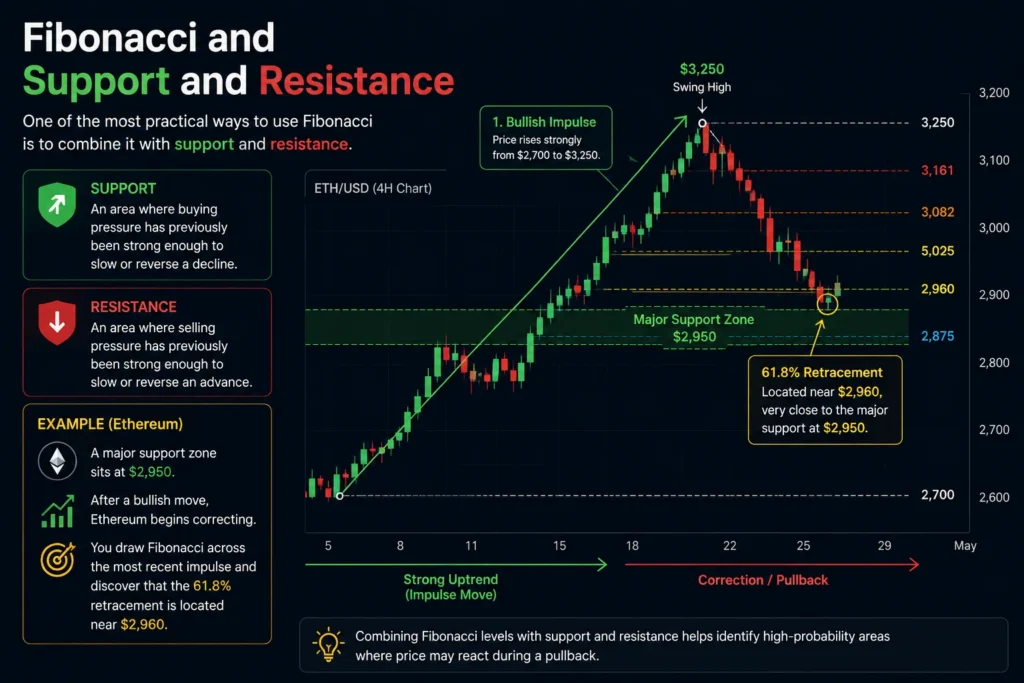
Fibonacci and Support and Resistance
One of the most practical ways to use Fibonacci is to combine it with support and resistance.
Support is an area where buying pressure has previously been strong enough to slow or reverse a decline.
Resistance is an area where selling pressure has previously been strong enough to slow or reverse an advance.
Now imagine that a major support zone sits at $2,950 on Ethereum.
After a bullish move, Ethereum begins correcting.
You draw Fibonacci across the most recent impulse and discover that the 61.8% retracement is located near $2,960.
The two technical references are very close:
Support: approximately $2,950
61.8% Fibonacci: approximately $2,960
Instead of treating $2,960 as an exact reversal price, you might define a broader area around those levels as a zone of confluence.
This is often more practical than relying on a single indicator.
What Is Fibonacci Confluence?
Confluence occurs when two or more independent technical observations identify approximately the same price area.
For example:
61.8% Fibonacci + horizontal support
is stronger analytically than simply:
61.8% Fibonacci
You could add additional evidence:
61.8% Fibonacci + horizontal support + trend line + bullish price action
The goal is not to add ten indicators until the chart confirms what you already want to believe.
Instead, each factor should provide genuinely useful information.
A good question is:
Would I still consider this factor important if Fibonacci were removed from the chart?
If the answer is yes, it may provide meaningful confluence.
Fibonacci and Price Action
Price action can help traders evaluate what actually happens when price reaches a Fibonacci zone.
Imagine Bitcoin is in an uptrend and begins retracing toward the 50% level.
There are two very different ways price could behave.
Scenario One: Strong Bearish Momentum
Bitcoin enters the Fibonacci area with several large bearish candles.
There is little evidence of buying.
Price closes below support and continues making lower lows.
In this situation, blindly buying the Fibonacci level may be dangerous.
Scenario Two: Rejection and Recovery
Bitcoin enters the same area, but selling momentum begins weakening.
A long lower wick forms.
Price attempts to move lower again but fails.
A bullish candle then closes above the short-term resistance created during the correction.
This behavior provides additional information.
The Fibonacci level itself has not changed.
What changed is how market participants behaved around it.
This is why price action confirmation can be valuable.
Candlestick Patterns Around Fibonacci Levels
Some traders combine Fibonacci with candlestick patterns.
Common examples include:
- Pin bars
- Hammer candles
- Shooting stars
- Bullish engulfing candles
- Bearish engulfing candles
- Morning star patterns
- Evening star patterns
However, candlestick names should not be treated as automatic signals either.
A bullish engulfing candle appearing randomly in the middle of a range may have limited significance.
The same pattern appearing at:
major support + 61.8% Fibonacci + bullish market structure
may deserve more attention.
Location matters.
Fibonacci and Trend Lines
Trend lines can also create confluence.
Suppose a cryptocurrency has been respecting an ascending trend line for several weeks.
The asset then makes another strong bullish move and begins correcting.
You draw Fibonacci across the latest impulse.
The 50% retracement happens to intersect with the rising trend line.
Now two technical methods independently identify approximately the same region.
If price reaches that zone and shows bullish confirmation, the setup may become more attractive.
However, trend lines are subjective.
Two traders may draw them slightly differently.
For that reason, avoid forcing a trend line to match a Fibonacci level. The confluence should appear naturally.
Fibonacci and Moving Averages
Some traders combine Fibonacci levels with moving averages such as:
- 20-period EMA;
- 50-period EMA;
- 100-period moving average;
- 200-period moving average.
Suppose EUR/USD is trending upward on the four-hour chart.
Price has remained above the 50 EMA throughout much of the trend.
After another bullish impulse, price begins retracing.
The 50 EMA is rising toward the 61.8% Fibonacci retracement.
This creates another potential confluence area.
A trader may wait to see whether price respects both references.
Again, neither the moving average nor Fibonacci guarantees a reversal.
They simply provide context for a trading decision.
Using Fibonacci for Entry Points
One of the most common questions is:
Which Fibonacci level is best for entering a trade?
There is no universal answer.
Some strategies focus on shallow retracements such as 38.2%.
Others prefer deeper corrections around 50% or 61.8%.
The appropriate level depends on:
- market conditions;
- volatility;
- timeframe;
- trend strength;
- trading style;
- confirmation method;
- risk tolerance.
In a very strong trend, waiting exclusively for a 61.8% retracement could mean missing many trades because price may only correct to 23.6% or 38.2%.
On the other hand, entering every 23.6% pullback can lead to poor entries during weak or changing trends.
This is why professional analysis focuses on context rather than a favorite number.
Aggressive vs. Conservative Fibonacci Entries
Traders can approach entries differently.
Aggressive Entry
An aggressive trader may place an order directly around a predefined Fibonacci zone.
For example:
Buy limit near the 61.8% retracement
The advantage is potentially obtaining a better entry before confirmation causes price to move away.
The disadvantage is obvious: price may simply continue through the level.
Confirmation Entry
A more conservative trader may wait for evidence of reversal.
For example:
- Price reaches the 61.8% zone.
- A rejection occurs.
- Short-term market structure changes.
- Price breaks above a nearby minor high.
- The trader enters after confirmation or a subsequent retest.
The entry price may be less attractive, but the trader receives more information before committing capital.
Neither approach guarantees better results. The correct choice depends on a tested trading plan.
How to Use Fibonacci for Stop-Loss Placement
A common mistake is placing a stop-loss immediately below a Fibonacci line simply because the line exists.
A stop-loss should ideally represent the point where the trade thesis becomes invalid.
Suppose you plan to buy near the 61.8% retracement.
If the relevant swing low is much lower, placing a stop just a few points below 61.8% may result in being stopped out by ordinary volatility even if the broader setup remains valid.
Instead, consider market structure.
Ask:
At what price would my reason for entering no longer make sense?
Possible structural invalidation points could include:
- below a significant swing low;
- beyond a support zone;
- beyond a confirmed demand area;
- above a swing high for short positions.
This approach connects the stop-loss to the trading idea rather than an arbitrary distance.
Position Size Matters More Than Stop Distance
A wider stop does not automatically mean taking more financial risk.
Position size can be adjusted.
Consider two hypothetical trades.
Trade A
Account size: $10,000
Risk: 1%
Maximum loss: $100
Stop distance: 20 pips
Trade B
Account size: $10,000
Risk: 1%
Maximum loss: $100
Stop distance: 50 pips
The position size for Trade B can be smaller so that both trades still risk approximately $100.
This principle is extremely important in Forex trading.
Your broker may provide high leverage, but leverage should not determine how much risk you take.
Risk should be determined by the trading plan.
The simplified principle is:
Position Size = Acceptable Monetary Risk ÷ Risk Per Unit
The exact calculation differs depending on whether you are trading currency pairs, cryptocurrency, CFDs, futures, or other instruments.
Fibonacci Extensions for Profit Targets
So far, we have focused mainly on retracements.
But Fibonacci can also be used to estimate possible targets when price moves beyond a previous swing.
This is where Fibonacci Extensions become useful.
Common extension levels include:
- 127.2%
- 161.8%
- 200%
- 261.8%
Suppose an asset rises from $100 to $120, retraces, and then resumes its bullish trend.
If price breaks above the previous $120 high, traders may use Fibonacci Extension levels to identify potential areas where the next wave could encounter resistance or where partial profits might be considered.
The 161.8% extension is particularly popular.
However, an extension level should not automatically become a take-profit order.
Traders should also consider:
- previous highs;
- psychological price levels;
- major resistance;
- volatility;
- market structure;
- risk-to-reward ratio.
A Practical Fibonacci Take-Profit Example
Imagine a cryptocurrency trade with the following simplified structure:
Swing Low: $50
Swing High: $60
Price then retraces toward a Fibonacci support area around $54.
After confirmation, a trader enters long at $55.
The stop-loss is placed at $52 based on market structure.
Risk per unit is:
$55 − $52 = $3
Suppose the trader identifies a potential target around $64.
Potential reward is:
$64 − $55 = $9
The approximate reward-to-risk ratio is therefore:
$9 ÷ $3 = 3
or:
3:1
This does not mean the trade will succeed.
It simply means the potential profit is approximately three times the predefined risk.
A trader can then decide whether this setup meets the requirements of the trading plan.
Using Multiple Take-Profit Targets
Some traders do not close the entire position at one target.
Instead, they scale out.
A hypothetical plan might be:
- Take partial profit near the previous swing high.
- Take another portion near the 127.2% extension.
- Target the 161.8% extension with the remaining position.
This approach may help balance the desire to lock in profits with the possibility of participating in a larger trend.
However, partial exits also change the actual reward-to-risk profile.
A strategy should therefore be evaluated using real calculations rather than assuming that multiple targets automatically improve performance.
Fibonacci Across Multiple Timeframes
One powerful way to improve Fibonacci analysis is to examine more than one timeframe.
Suppose you trade on the one-hour chart.
Instead of analyzing only that timeframe, you could use:
Daily chart → broader trend
4-hour chart → major structure
1-hour chart → trading setup
15-minute chart → optional entry refinement
For example, the daily trend may be bullish.
On the four-hour chart, price is correcting toward a major 50% Fibonacci level.
On the one-hour chart, that area contains established support.
On the 15-minute chart, price begins forming a bullish structural reversal.
This provides a more complete picture than simply seeing a Fibonacci line on one timeframe.
Fibonacci Confluence Across Different Swings
Another technique used by some traders is Fibonacci clustering.
This occurs when Fibonacci levels from different meaningful swings appear close together.
For example:
- 61.8% retracement from a large swing = $72.50
- 38.2% retracement from a smaller swing = $72.80
- Previous horizontal support = $72.60
Instead of three unrelated prices, the trader may identify approximately $72.50–$72.80 as a broader technical zone.
This does not guarantee a reaction.
But it can help prioritize areas on the chart.
A Complete Fibonacci Trading Workflow
A structured Fibonacci trading process could look like this:
- Determine the higher-timeframe market direction.
- Mark major support and resistance zones.
- Identify a meaningful impulse swing.
- Draw Fibonacci Retracement correctly.
- Look for overlap between Fibonacci and existing technical zones.
- Wait for price to approach the area rather than chasing it.
- Observe price action and market structure.
- Define the invalidation point.
- Calculate position size based on acceptable risk.
- Identify realistic profit targets.
- Evaluate the reward-to-risk relationship.
- Execute only if the setup satisfies the trading plan.
- Record the trade for later review.
This final step is often overlooked.
Back testing a Fibonacci Strategy
If you want to know whether a Fibonacci strategy works for your trading style, relying on a few memorable examples is not enough.
You need data.
A simple back test could examine at least 100 historical setups that follow the same rules.
Record information such as:
- asset or currency pair;
- timeframe;
- trend direction;
- Fibonacci level used;
- confirmation signal;
- entry price;
- stop-loss;
- target;
- outcome;
- reward-to-risk ratio;
- maximum adverse movement;
- maximum favorable movement.
After collecting enough trades, you can evaluate the strategy more objectively.
For example, suppose a strategy wins only 45% of the time.
That may initially sound poor.
But imagine the average winning trade produces twice the amount lost on an average losing trade.
Over a sufficiently large sample, such a system could potentially have positive expectancy before costs.
A simplified expectancy formula is:
Expectancy = (Win Rate × Average Win) − (Loss Rate × Average Loss)
Suppose:
Win rate = 45%
Average win = 2R
Loss rate = 55%
Average loss = 1R
Then:
(0.45 × 2) − (0.55 × 1)
0.90 − 0.55 = 0.35R
The theoretical expectancy would be +0.35R per trade before considering spreads, commissions, slippage, execution differences, and other real-world factors.
This example highlights an important lesson:
A profitable strategy does not need to predict every Fibonacci reversal correctly.
What matters is how the entire trading system performs over a meaningful sample.
Why Broker Conditions Matter When Testing Fibonacci Strategies
When testing a strategy in Forex, do not ignore the conditions provided by your broker.
A historical chart may suggest a perfect entry and exit, but actual trading includes costs.
These may include:
- spreads;
- commissions;
- swaps or overnight financing;
- slippage;
- execution delays;
- variable spreads during volatile periods.
Imagine a short-term Fibonacci strategy targeting only 10 pips per trade.
If the total trading cost is 2 pips, costs represent a significant portion of the potential return.
For a longer-term strategy targeting 200 pips, the same transaction cost may have a much smaller proportional impact.
This is one reason why backtesting should attempt to reflect realistic trading conditions.
Avoid Searching for a “Perfect” Fibonacci Level
There is no Fibonacci ratio that always works.
The 61.8% level is not automatically better than 38.2%.
The 50% level is not always the safest entry.
And deeper retracements do not automatically provide better risk-to-reward opportunities.
Markets change.
Strong trends can produce shallow pullbacks.
Weak trends can experience deep retracements.
Ranges can generate repeated false signals.
Major news can push price through several technical levels in seconds.
Instead of asking:
“Which Fibonacci level always works?”
Ask:
“Under what market conditions does my Fibonacci setup historically perform best?”
That question can actually be tested.
The Difference Between Using Fibonacci and Having a Strategy
This distinction is crucial.
Knowing how to draw Fibonacci does not mean you have a trading strategy.
A strategy requires rules.
At minimum, those rules should answer:
- What markets will you trade?
- What timeframe will you use?
- How will you define the trend?
- Which swings qualify for Fibonacci measurement?
- Which retracement levels matter?
- What confirmation is required?
- What triggers the entry?
- Where is the stop-loss?
- How is position size calculated?
- Where will profits be taken?
- When should a trade be avoided?
Without these rules, Fibonacci can easily become subjective.
After a losing trade, a trader may change the swing.
After another loss, the trader may change the preferred Fibonacci level.
Then the confirmation indicator changes.
Eventually, the strategy becomes impossible to evaluate because the rules constantly move.
A better approach is to create a clear hypothesis, test it, record the results, and improve it based on evidence.
Fibonacci Is a Framework, Not a Shortcut
Fibonacci can make a chart more structured, but it cannot eliminate uncertainty.
The tool can help answer questions such as:
How deep is this correction?
Where might a pullback become technically interesting?
Does this area overlap with previous support or resistance?
Where could an extension target appear?
What Fibonacci cannot reliably tell you is:
“Price will definitely reverse here.”
That certainty does not exist.
Whether you trade Forex, cryptocurrency, indices, or other markets, sustainable technical analysis requires a combination of market context, repeatable rules, disciplined risk management, and realistic expectations.
Advanced Fibonacci Trading Techniques
Once traders understand how to draw Fibonacci correctly and combine it with market structure, the next challenge is using the tool consistently. This is where many strategies either become more reliable or break down completely.
The problem is usually not the Fibonacci tool itself. The problem is how it is interpreted.
Some traders treat every 61.8% retracement as a reversal signal. Others keep redrawing swings until the chart supports the trade they already want to take. Some ignore volatility, news, spread, and execution conditions from their broker. In Forex and cryptocurrency markets, these mistakes can quickly turn a useful analytical tool into a source of confusion.
The goal of advanced Fibonacci analysis is therefore not to find a secret level. It is to build a repeatable framework that can be tested, measured, and improved over time.
Fibonacci Retracement vs. Fibonacci Extension
Two of the most commonly used Fibonacci tools are Retracement and Extension.
They serve different purposes.
Fibonacci Retracement
Fibonacci Retracement is mainly used to measure a correction inside an existing price swing.
Suppose an asset moves from $100 to $150 and then begins pulling back.
A trader can draw Fibonacci across the $100–$150 move and monitor potential retracement zones such as:
- 23.6%
- 38.2%
- 50%
- 61.8%
- 78.6%
The trader is essentially asking:
How much of the previous move has price given back?
Fibonacci Extension
Fibonacci Extension is generally used to project possible targets beyond the previous swing.
Common extension levels include:
- 127.2%
- 161.8%
- 200%
- 261.8%
The trader is asking a different question:
If the trend continues, where could price potentially travel next?
This distinction is important.
Retracement is usually about potential pullback areas.
Extension is usually about potential continuation targets.
How Fibonacci Extensions Can Be Used in Trending Markets
Imagine EUR/USD rises from 1.0800 to 1.1000, retraces to 1.0900, and then begins moving higher again.
Once price breaks above 1.1000, the previous resistance has been exceeded.
At that point, a trader may use extension levels to estimate potential areas where the next advance could slow or react.
For example:
161.8% extension → potential continuation target
However, extension levels should not be interpreted in isolation.
Suppose the 161.8% extension is located around 1.1150, but major weekly resistance exists at 1.1120.
The weekly resistance may be more important than the mathematical extension.
A trader might therefore consider the broader area rather than focusing on the exact extension price.
Fibonacci in Strong Trends vs. Weak Trends
Not all market environments behave the same way.
This matters because Fibonacci retracements can look very different depending on trend strength.
Strong Trends
In a strong bullish trend, corrections may remain relatively shallow.
Price may repeatedly retrace to:
- 23.6%;
- 38.2%;
- or around 50%;
before continuing higher.
Waiting only for 61.8% could mean missing many opportunities.
Weak or Mature Trends
When a trend loses momentum, corrections may become deeper.
Price may repeatedly reach:
- 50%;
- 61.8%;
- 78.6%;
or even retrace the entire previous move.
A deep retracement is not necessarily an attractive opportunity. It can also indicate that the previous trend is weakening.
This is why traders should consider Fibonacci together with market structure.
If price reaches the 78.6% retracement while also breaking a series of important structural levels, the trend may be changing rather than simply correcting.
Fibonacci in Sideways Markets
Fibonacci can be less useful in highly choppy or directionless markets.
Imagine price moving repeatedly between $100 and $105 without creating a clear trend.
You could technically draw Fibonacci across several swings, but the levels may overlap repeatedly and create little useful information.
In ranging markets, support and resistance boundaries may be more relevant than Fibonacci measurements of small internal movements.
This does not mean Fibonacci can never be used in a range.
It means the trader should first understand the market environment.
A tool designed to measure retracements becomes more useful when there is a meaningful directional move to measure.
How Volatility Affects Fibonacci Levels
Volatility is especially important in cryptocurrency markets.
Bitcoin, Ethereum, and smaller digital assets can move quickly through technical levels before reversing.
For example, price may temporarily break below the 61.8% retracement, reach 70%, and then recover strongly.
A trader using an extremely tight stop just below 61.8% could be stopped out before the expected reversal develops.
This is one reason traders should consider:
- average volatility;
- recent candle size;
- ATR or another volatility measure;
- nearby liquidity zones;
- market structure;
- position sizing.
A volatile asset may require a wider invalidation zone than a relatively stable currency pair.
However, a wider stop should generally be matched with a smaller position size if the trader wants to maintain the same monetary risk.
Fibonacci and Liquidity
Modern price action analysis often focuses heavily on liquidity.
Liquidity tends to accumulate around visible areas such as:
- previous highs;
- previous lows;
- equal highs;
- equal lows;
- range boundaries;
- obvious support and resistance.
These areas often contain stop orders.
Now imagine a Fibonacci retracement level appears directly below a previous low.
A beginner may buy the Fibonacci level immediately.
However, price could first move below the previous low, trigger stops, and then reverse.
This type of movement is sometimes described as a liquidity sweep or stop hunt.
The key lesson is not that every market movement is manipulated.
Instead, traders should understand that obvious technical levels are rarely isolated. They exist within a broader structure of orders and liquidity.
Combining Fibonacci with Market Structure Breaks
One way to reduce premature entries is to wait for a change in short-term market structure.
Suppose a bullish trend enters a deep correction.
Price reaches the 61.8% retracement.
Instead of buying immediately, the trader waits.
During the pullback, price has been making:
Lower Highs + Lower Lows
Then, near the Fibonacci zone, price stops falling and breaks above the most recent lower high.
This may suggest that short-term bearish momentum is weakening.
A potential workflow could be:
- Higher-timeframe trend is bullish.
- Price retraces into the 50%–61.8% area.
- The zone overlaps with support.
- Short-term bearish structure stops.
- Price breaks above a recent lower high.
- A retest occurs.
- Entry is considered after confirmation.
This is often more disciplined than blindly entering at the first Fibonacci touch.
Fibonacci and Supply and Demand Zones
Supply and demand analysis can also be combined with Fibonacci.
A demand zone is an area where strong buying previously emerged.
A supply zone is an area where strong selling previously appeared.
Suppose Ethereum rallies from a demand zone and creates a new swing high.
Afterward, price begins correcting.
The 61.8% retracement falls directly inside the original demand zone.
That overlap can create a technically interesting area.
The trader now has multiple reasons to monitor the zone:
- previous buying pressure;
- Fibonacci retracement;
- bullish trend structure;
- possible favorable risk-to-reward.
The trade still requires confirmation and risk management.
Fibonacci and Fair Value Gaps
Some price action strategies also combine Fibonacci with imbalance zones or so-called fair value gaps.
The basic idea is that rapid price movement may leave an area where trading activity was relatively inefficient.
Suppose price makes a strong bullish impulse.
A small imbalance appears during the move.
Later, the correction reaches:
50% Fibonacci + imbalance zone + previous resistance turned support
This may create a higher-confluence area.
However, traders should be careful not to overload charts with too many concepts.
More indicators and labels do not automatically produce better decisions.
The Problem of Over-Confluence
Confluence is useful, but it can also become misleading.
A trader may add:
- Fibonacci;
- RSI;
- MACD;
- moving averages;
- Bollinger Bands;
- trend lines;
- support;
- volume;
- supply and demand;
- candlestick patterns.
Eventually, almost any trade can be justified.
This creates confirmation bias.
A better approach is to use a small number of tools that provide different types of information.
For example:
Trend structure + Fibonacci + support/resistance + price confirmation
may be enough.
Each tool should have a clear purpose.
Fibonacci and RSI
The Relative Strength Index can sometimes complement Fibonacci analysis.
Suppose price is in an uptrend and retraces toward 61.8%.
At the same time, RSI has moved from an overbought region toward a neutral or oversold reading.
This may suggest that momentum has cooled during the correction.
However, RSI reaching a certain value does not mean the Fibonacci level must hold.
Instead, it can provide another piece of context.
A more useful question is:
Does momentum behavior support the broader trading thesis?
Fibonacci and Moving Average Trends
Moving averages can help identify whether a Fibonacci retracement is occurring within a broader directional trend.
For example, a trader may use the 200-period moving average as a broad trend filter.
If price remains above the 200 MA and makes a bullish impulse, the trader may focus mainly on Fibonacci pullbacks for long opportunities.
If price remains below the 200 MA, bearish pullbacks may receive more attention.
This approach reduces the temptation to trade every Fibonacci level in both directions.
How News Can Invalidate a Fibonacci Setup
Technical levels can become less reliable during major news events.
In Forex, important events may include:
- central bank interest-rate decisions;
- inflation data;
- employment reports;
- GDP releases;
- major geopolitical developments.
In cryptocurrency, market-moving events may include:
- regulatory announcements;
- exchange failures;
- ETF-related decisions;
- major protocol events;
- unexpected security incidents.
A Fibonacci level may appear technically perfect before the news and become irrelevant seconds later.
Volatility can increase dramatically, spreads can widen, and execution quality may deteriorate.
A broker may also apply different margin or trading conditions during extreme volatility.
This is why traders should know when major events are scheduled and decide in advance whether their strategy permits trading around them.
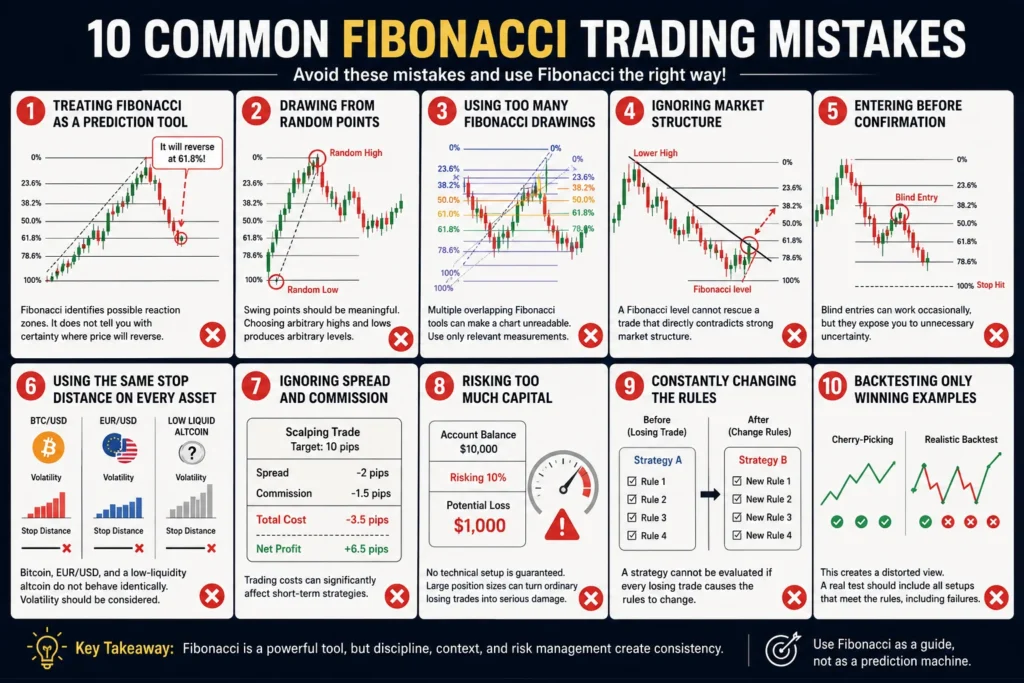
Common Fibonacci Trading Mistakes
Understanding mistakes can be as important as understanding the tool itself.
- Treating Fibonacci as a Prediction Tool
Fibonacci identifies possible reaction zones.
It does not tell you with certainty where price will reverse.
- Drawing From Random Points
Swing points should be meaningful.
Choosing arbitrary highs and lows produces arbitrary levels.
- Using Too Many Fibonacci Drawings
Multiple overlapping Fibonacci tools can make a chart unreadable.
Use only measurements that are relevant to the current analysis.
- Ignoring Market Structure
A Fibonacci level cannot rescue a trade that directly contradicts strong market structure.
- Entering Before Confirmation
Blind entries can work occasionally, but they expose traders to unnecessary uncertainty.
- Using the Same Stop Distance on Every Asset
Bitcoin, EUR/USD, and a low-liquidity altcoin do not behave identically.
Volatility should be considered.
- Ignoring Spread and Commission
Trading costs can significantly affect short-term strategies.
- Risking Too Much Capital
No technical setup is guaranteed.
Large position sizes can turn ordinary losing trades into serious account damage.
- Constantly Changing the Rules
A strategy cannot be evaluated if every losing trade causes the rules to change.
- Backtesting Only Winning Examples
This creates a distorted view.
A real test should include all setups that meet the rules, including failures.
Image 5
A Practical Fibonacci Forex Setup
Consider a hypothetical Forex example.
EUR/USD is in a clear four-hour bullish trend.
Price moves from:
1.0700 → 1.1100
A correction begins.
You draw Fibonacci from the swing low to swing high.
The 61.8% retracement appears near a previous breakout zone.
You then observe the following:
- daily trend remains bullish;
- four-hour support remains intact;
- price reaches the Fibonacci zone;
- selling momentum weakens;
- a bullish rejection candle forms;
- one-hour structure breaks upward.
You decide to consider an entry only after the confirmation.
The setup may be structured as:
Entry: after bullish confirmation
Invalidation: below the relevant swing low or support zone
Target 1: previous high
Target 2: Fibonacci Extension
Risk: predetermined percentage of account equity
This is a complete trading framework.
The Fibonacci level is only one component.
A Practical Cryptocurrency Setup
Now consider Bitcoin.
Suppose BTC rises from:
$92,000 → $100,000
After reaching $100,000, price pulls back.
The 50% retracement appears around $96,000.
The area also corresponds with:
- prior resistance;
- a high-volume zone;
- a short-term demand area.
Instead of immediately buying at $96,000, the trader waits.
Price briefly falls below the area, returns above it, and then breaks a minor lower high.
That recovery may be interpreted as confirmation.
A trader might then create a plan with:
Entry: after the structural break
Stop: below the relevant invalidation point
Target: previous high and possible extension levels
Because Bitcoin can be volatile, position size should reflect the stop distance and total acceptable risk.
Risk Management Should Come Before Profit Targets
Many beginners ask:
Where should I take profit?
A more important question is:
How much am I prepared to lose if this idea is wrong?
Before entering a trade, the trader should define:
- account size;
- percentage risk;
- monetary risk;
- stop location;
- position size.
Suppose a trader has a $5,000 account and chooses to risk 1%.
Maximum planned loss:
$5,000 × 1% = $50
If the stop-loss distance requires a smaller position, the position should be reduced.
The trader should not widen the risk simply because the Fibonacci setup looks attractive.
Risk-to-Reward Ratio and Fibonacci
Fibonacci can help identify logical targets, but the trade should still make sense from a risk-to-reward perspective.
Suppose:
Entry = $100
Stop = $95
Risk = $5
Potential target = $110
Reward = $10
Reward-to-risk ratio:
$10 ÷ $5 = 2
or approximately:
2:1
Now suppose the nearest strong resistance is actually at $104.
Reward would only be:
$4
Risk remains $5.
The reward-to-risk ratio becomes less than 1:1.
Even though the Fibonacci entry may look attractive, the overall trade may not be.
This is why chart analysis should always include both entry and exit logic.
How to Create a Fibonacci Trading Journal
A trading journal can help determine whether Fibonacci actually adds value to your strategy.
For each trade, record:
- date;
- asset;
- market;
- timeframe;
- trend direction;
- swing points;
- Fibonacci level;
- confluence factors;
- entry reason;
- stop-loss;
- target;
- position size;
- result;
- screenshot;
- emotional state;
- mistakes;
- lessons learned.
After 50, 100, or more trades, patterns may become visible.
You might discover that:
- 61.8% setups work better in trending markets;
- 38.2% performs better during high momentum;
- one currency pair performs better than another;
- cryptocurrency setups require wider stops;
- trading during major news reduces performance.
This is far more valuable than simply memorizing Fibonacci ratios.
How to Test Whether Fibonacci Adds Real Value
An advanced trader should ask a difficult question:
Does Fibonacci actually improve my strategy?
One way to test this is by comparing two systems.
System A
Trend + support/resistance + price action
System B
Trend + support/resistance + price action + Fibonacci
If System B produces better expectancy over a meaningful sample, Fibonacci may add value.
If performance remains identical, Fibonacci may simply be adding complexity.
This type of comparison is important because traders sometimes become emotionally attached to indicators.
A tool should earn its place in the strategy.
Should Beginners Use Fibonacci?
Fibonacci can be useful for beginners because it teaches several important concepts:
- measuring price swings;
- understanding retracements;
- identifying pullbacks;
- thinking in zones;
- combining technical factors;
- planning entries and exits.
However, beginners should avoid trying to memorize every Fibonacci ratio.
It is more important to understand:
trend + structure + retracement + confirmation + risk
Once these concepts are clear, Fibonacci becomes much easier to use correctly.
Fibonacci in Forex vs. Cryptocurrency
Fibonacci can be used in both markets, but conditions differ.
Forex
Forex often offers:
- deep liquidity in major currency pairs;
- relatively tight spreads;
- structured trading sessions;
- scheduled macroeconomic events.
Broker quality, spread, leverage, and execution remain important.
Cryptocurrency
Cryptocurrency markets can offer:
- 24/7 trading;
- higher volatility;
- rapid sentiment shifts;
- stronger weekend activity;
- greater variation between assets.
Fibonacci works mathematically the same way, but practical execution and risk management may need to be adjusted.
Choosing a Broker for Fibonacci-Based Trading
A trading strategy should not be evaluated independently of execution conditions.
When choosing a broker, consider:
- regulation;
- reputation;
- spread structure;
- commissions;
- execution speed;
- slippage;
- available markets;
- chart quality;
- order types;
- withdrawal policies;
- customer support.
A low spread alone does not necessarily make a broker suitable.
For short-term Fibonacci strategies, poor execution can materially affect results.
For longer-term setups, financing costs and overnight fees may become more important.
Always review the broker’s official terms and legal status in your jurisdiction before depositing funds.
Final Fibonacci Trading Checklist
Before placing a trade based on Fibonacci, ask:
- Is the market trending or ranging?
- Did I select a meaningful swing?
- Did I draw Fibonacci in the correct direction?
- Does the retracement level overlap with real support or resistance?
- Is market structure still aligned with the trade?
- Do I have confirmation?
- Where is the setup invalidated?
- What is my monetary risk?
- Is my position size appropriate?
- Is the potential reward worth the risk?
- Is important news approaching?
- Are spread and execution conditions acceptable?
- Am I following tested rules rather than emotion?
If several of these questions cannot be answered clearly, the trade may not be ready.
Final Thoughts
Fibonacci remains popular because it gives traders a simple framework for measuring price corrections and projecting possible continuation targets.
Its real value does not come from predicting exact turning points.
Its value comes from helping traders organize market information.
Used correctly, Fibonacci can help answer several practical questions:
- How deep is the current pullback?
- Where does the correction overlap with support or resistance?
- Is the trend still structurally valid?
- Where might a continuation target appear?
- Is the setup offering an acceptable reward relative to risk?
Used incorrectly, Fibonacci can become little more than a collection of arbitrary lines.
The difference comes down to discipline.
A trader who combines Fibonacci with market structure, confirmation, realistic position sizing, back testing, and appropriate broker conditions is using the tool as part of a professional process.
A trader who buys every 61.8% touch is simply relying on hope.