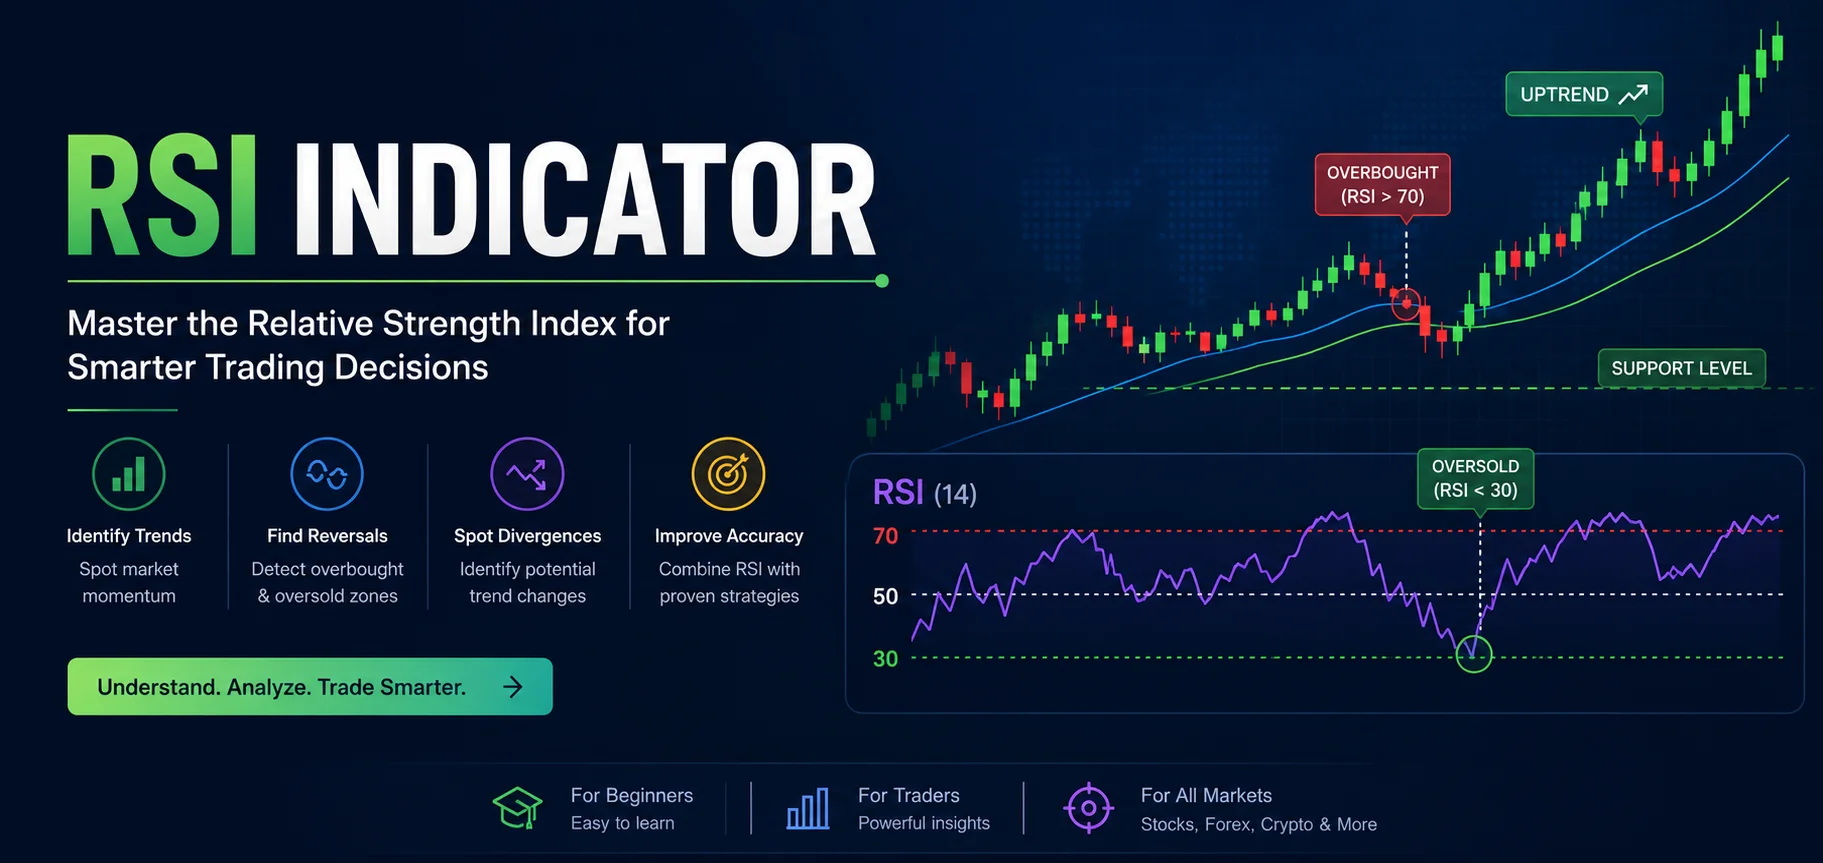
RSI Indicator : A Complete Guide
RSI Indicator: A Complete Guide to Understanding the Relative Strength Index
The RSI Indicator is one of the most widely used technical analysis tools in financial markets. Whether you trade Forex, stocks, cryptocurrencies, commodities, or indices, understanding how the relative strength index works can significantly improve your market analysis and decision-making process.
Despite its popularity, many traders misunderstand what the indicator actually measures. They often assume that an RSI reading above 70 automatically means it’s time to sell or that a reading below 30 guarantees a buying opportunity. In reality, The Relative Strength Index (RSI) is much more sophisticated than a simple overbought and oversold indicator.
Professional traders rarely rely on RSI alone. Instead, they combine it with price action, trend analysis, support and resistance levels, market structure, volume, and other technical indicators to build high-probability trading strategies.
In this comprehensive guide, you’ll learn everything from the fundamentals of the RSI Indicator to advanced trading concepts used by experienced market participants. Whether you’re just beginning your trading journey or looking to refine your technical analysis skills, this guide will help you understand how to use RSI more effectively while avoiding many of the common mistakes that lead to poor trading decisions.
What Is the RSI Indicator?
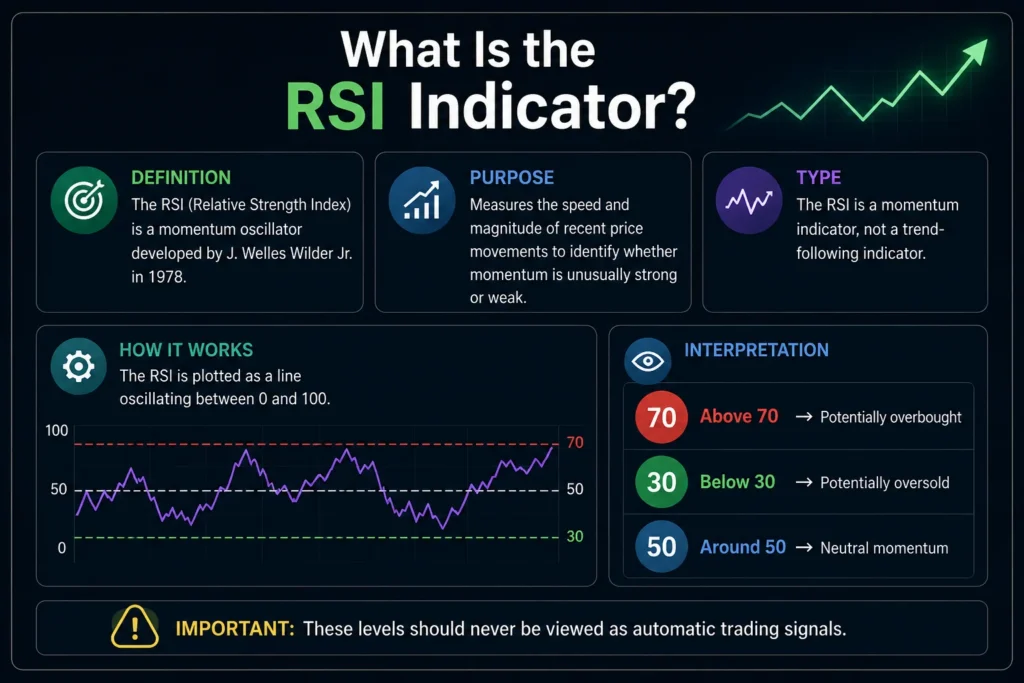
The RSI Indicator, short for Relative Strength Index, is a momentum oscillator developed by J. Welles Wilder Jr. and introduced in his landmark 1978 book New Concepts in Technical Trading Systems.
Its primary purpose is to measure the speed and magnitude of recent price movements. Instead of telling traders where the market will go next, it provides insight into whether recent buying or selling momentum has become unusually strong or weak.
Unlike trend-following indicators such as Moving Averages, the RSI Indicator belongs to the category of momentum indicators, meaning it evaluates the strength behind price movements rather than simply following the trend.
The RSI is displayed as a line oscillating between 0 and 100.
Generally accepted interpretation includes:
- Above 70 → Potentially overbought
- Below 30 → Potentially oversold
- Around 50 → Neutral momentum
However, these levels should never be viewed as automatic trading signals.
Why the RSI Indicator Is So Popular
The popularity of the RSI Indicator comes from its simplicity and versatility.
It works across nearly every financial market, including:
- Forex
- Stocks
- ETFs
- Cryptocurrency
- Commodities
- Futures
- Indices
It is also effective across multiple timeframes:
- 1-minute charts
- 5-minute charts
- Hourly charts
- Daily charts
- Weekly charts
- Monthly charts
This flexibility makes the indicator valuable for:
- Day traders
- Swing traders
- Position traders
- Long-term investors
One of the biggest advantages is that RSI can adapt to different market conditions without requiring complex calculations from the trader.
Understanding Momentum in Financial Markets
Before diving deeper into The Relative Strength Index (RSI), it’s essential to understand momentum.
Momentum simply refers to the strength behind a price movement.
Imagine two different situations.
Example 1
A stock rises:
- Monday: +0.2%
- Tuesday: +0.1%
- Wednesday: +0.3%
The price is increasing, but momentum is relatively weak.
Example 2
Another stock rises:
- Monday: +3%
- Tuesday: +4%
- Wednesday: +5%
Here, buyers are clearly in control.
Both stocks are moving upward.
However, the second has much stronger momentum.
The RSI Indicator helps quantify this difference.
How the Relative Strength Index Works
The relative strength index compares the average gains against the average losses over a specified period.
The default period is 14 candles, although traders can adjust this depending on their strategy.
The calculation measures:
- Average bullish movement
- Average bearish movement
These values are transformed into a number between 0 and 100.
Rather than focusing on the mathematical formula, traders should understand what the numbers actually represent.
For example:
| RSI Value | Interpretation |
|---|---|
| 90 | Extremely strong bullish momentum |
| 80 | Very strong buying pressure |
| 70 | Strong momentum |
| 60 | Healthy bullish trend |
| 50 | Balanced market |
| 40 | Weakening buyers |
| 30 | Strong selling pressure |
| 20 | Very bearish momentum |
| 10 | Extreme selling activity |
Notice that none of these values guarantee price reversal.
They simply describe momentum conditions.
Who Created the RSI Indicator?
The RSI Indicator was created by J. Welles Wilder Jr., one of the pioneers of modern technical analysis.
His contributions include several indicators still widely used today, including:
- Relative Strength Index (RSI)
- Average True Range (ATR)
- Parabolic SAR
- Average Directional Index (ADX)
Wilder designed these tools to help traders better understand market behavior without relying solely on intuition.
Decades later, his indicators remain standard features on nearly every trading platform.
What Does RSI Actually Measure?
Many beginners believe RSI measures whether an asset is expensive or cheap.
It does not.
Instead, it measures the strength of recent price changes.
Consider these examples.
Scenario A
Price rises slowly over three weeks.
RSI may remain around 55.
Scenario B
Price jumps aggressively in only three days.
RSI could exceed 80.
Both assets increased in value.
However, the second experienced much stronger buying momentum.
That distinction is what The Relative Strength Index (RSI) captures.
Why Overbought Doesn’t Always Mean Sell
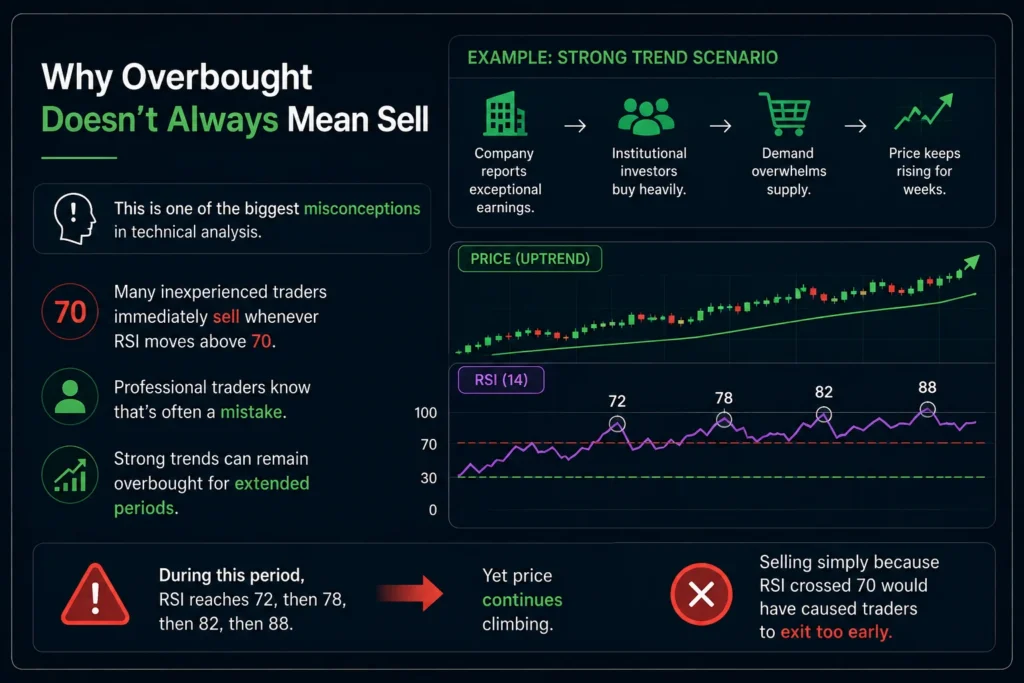
This is one of the biggest misconceptions in technical analysis.
Many inexperienced traders immediately sell whenever RSI moves above 70.
Professional traders know that’s often a mistake.
Imagine a company reporting exceptional earnings.
Institutional investors begin buying heavily.
Demand overwhelms supply.
Price keeps rising for weeks.
During this period:
- RSI reaches 72
- Then 78
- Then 82
- Then 88
Yet price continues climbing.
Selling simply because RSI crossed 70 would have caused traders to exit too early.
Strong trends can remain overbought for extended periods.
Why Oversold Doesn’t Always Mean Buy
The opposite is equally important.
A falling market can remain oversold much longer than expected.
For example:
A cryptocurrency loses 40% over two weeks.
RSI falls to:
- 29
- 24
- 21
- 18
Many traders buy at 29.
Others buy again at 24.
Then again at 21.
Price continues collapsing.
The RSI wasn’t wrong.
It simply indicated exceptionally strong selling momentum.
It never promised an immediate reversal.
The Psychology Behind RSI
Markets move because of human behavior.
Fear.
Greed.
Excitement.
Panic.
Confidence.
Uncertainty.
The RSI Indicator indirectly measures these emotional swings.
High RSI often reflects:
- Aggressive buying
- Fear of missing out (FOMO)
- Investor optimism
- Strong demand
Low RSI often reflects:
- Panic selling
- Capitulation
- Fear
- Liquidation
Understanding market psychology helps traders avoid emotional decisions themselves.
RSI in Trending Markets
One of the most important lessons experienced traders learn is that RSI behaves differently depending on market conditions.
In a strong uptrend:
- RSI often stays above 40
- Pullbacks frequently stop near 40–50
- RSI repeatedly reaches 70–80
In a strong downtrend:
- RSI usually stays below 60
- Rallies often fail around 50–60
- RSI frequently visits 20–30
This concept is called RSI range shifts.
Recognizing these shifts helps traders identify the dominant trend.
RSI During Sideways Markets
Markets don’t trend forever.
Sometimes price simply moves sideways.
This is where the RSI Indicator often performs best.
Inside a trading range:
- Overbought conditions often lead to pullbacks.
- Oversold conditions often lead to rebounds.
- Momentum oscillates naturally.
This environment makes RSI reversal signals more reliable compared to strong trending markets.
However, confirmation is still essential.
Common RSI Settings
Although 14 periods remain the industry standard, traders frequently customize RSI settings.
Popular configurations include:
RSI 14
The classic setting.
Best for:
- Swing trading
- General analysis
- Daily charts
RSI 9
More sensitive.
Produces:
- More signals
- Earlier warnings
- Increased false signals
Suitable for:
- Active traders
- Lower timeframes
RSI 21
Less sensitive.
Provides:
- Smoother movements
- Higher-quality signals
- Fewer entries
Preferred by:
- Position traders
- Long-term investors
Advantages of the RSI Indicator
The RSI Indicator has remained popular for decades because it offers numerous practical benefits.
Some of its biggest strengths include:
- Easy to understand
- Beginner-friendly
- Works across multiple markets
- Compatible with every major trading platform
- Helps identify momentum
- Can highlight weakening trends
- Useful for spotting divergences
- Effective across various timeframes
- Complements other technical indicators
- Encourages disciplined trading decisions
These qualities explain why both retail and institutional traders continue to incorporate the RSI into their analysis.
Limitations of the RSI Indicator
Like every technical indicator, RSI has weaknesses.
Understanding these limitations is just as important as knowing its strengths.
Some of the most common drawbacks include:
- It does not predict future prices.
- Strong trends can keep RSI overbought or oversold for long periods.
- False signals occur frequently in volatile markets.
- Different settings produce different results.
- RSI should never be used in isolation.
- It reacts to price rather than leading it.
- News events can quickly invalidate technical signals.
Successful traders recognize that the relative strength index is a decision-support tool—not a crystal ball.
Markets Where the RSI Indicator Performs Well
One reason for the widespread adoption of The Relative Strength Index (RSI) is its adaptability across different asset classes.
Examples include:
Forex
Currency traders often use RSI to assess momentum during trending and ranging conditions. It is particularly useful when combined with support and resistance levels or moving averages.
Stocks
Equity investors monitor RSI to evaluate whether buying or selling pressure is accelerating. It can help identify momentum shifts around earnings seasons or major market events.
Cryptocurrencies
Digital assets are known for high volatility. RSI can highlight extreme momentum conditions, though traders should be cautious because crypto markets can remain overbought or oversold for extended periods.
Commodities
Gold, oil, silver, and agricultural products often experience cyclical movements where RSI can assist in spotting momentum changes alongside macroeconomic analysis.
Indices
Index traders use RSI to evaluate the strength of broader market trends, helping determine whether bullish or bearish momentum is expanding or fading.
By adapting the indicator to the specific characteristics of each market, traders can gain a clearer perspective on price behavior without relying on a single signal.
How to Read the RSI Indicator Correctly
Knowing what the RSI Indicator is and understanding its calculation is only the beginning. The real skill lies in interpreting the information it provides within the context of the market.
One of the biggest reasons traders fail with the relative strength index is that they expect it to generate automatic buy and sell signals. In reality, RSI is a context-based tool. The same RSI reading can mean very different things depending on trend direction, volatility, market sentiment, and nearby support or resistance levels.
Professional traders always ask questions such as:
- Is the market trending or ranging?
- Is momentum increasing or fading?
- Is price approaching a significant support or resistance level?
- Does RSI agree with price action?
- Are multiple indicators confirming the same idea?
These questions transform RSI from a simple oscillator into a powerful analytical tool.
Understanding RSI Levels
Although RSI moves between 0 and 100, not every value has equal significance.
RSI Above 70
Traditionally, an RSI above 70 indicates that buying momentum has become unusually strong.
This does not necessarily mean the market must fall.
Instead, it tells traders that buyers have dominated recent price action.
Possible interpretations include:
- Strong bullish momentum
- Increased buying pressure
- Potential profit-taking
- Higher probability of short-term consolidation
Experienced traders wait for additional confirmation before considering a bearish position.
RSI Below 30
An RSI below 30 suggests that selling pressure has been unusually strong.
Again, this should never be viewed as an automatic buying opportunity.
Instead, traders should evaluate:
- Is selling momentum slowing?
- Has price reached historical support?
- Are buyers beginning to return?
- Is volume increasing?
Oversold conditions often signal opportunity—but only after confirmation.
RSI Around 50
Many traders ignore the midpoint.
That is a mistake.
An RSI near 50 often provides valuable information.
Generally speaking:
- Above 50 → Buyers hold a slight advantage.
- Below 50 → Sellers maintain stronger momentum.
Some trend-following traders use the 50 level as a trend filter rather than relying on the 70/30 thresholds.
The Importance of Market Context
Imagine two different charts.
Example One
Price rises steadily for three months.
RSI remains between:
- 55
- 68
- 72
- 75
Despite being overbought several times, price continues making higher highs.
Selling every time RSI exceeded 70 would have been costly.
Example Two
Price moves sideways for several weeks.
RSI repeatedly reaches:
- 72
- Then falls
- Drops to 28
- Then rebounds
Here, overbought and oversold signals become much more reliable because the market lacks a strong trend.
The lesson is simple:
The RSI Indicator should always be interpreted within the current market structure.
Using RSI in Bull Markets
Bull markets behave differently than many beginners expect.
Instead of constantly returning below 30, RSI often stays elevated.
Characteristics include:
- RSI frequently remains above 40.
- Pullbacks often stop between 40 and 50.
- New highs push RSI toward 70 or even 80.
- Momentum remains healthy for extended periods.
Professional traders often buy pullbacks rather than shorting overbought conditions during strong uptrends.
Using RSI in Bear Markets
Bearish markets show the opposite behavior.
Common characteristics include:
- RSI struggles to move above 60.
- Oversold readings occur more frequently.
- Momentum remains negative.
- Short rallies fail quickly.
Understanding these behavioral differences helps traders avoid trading against dominant market momentum.
RSI Range Shift Explained
One advanced concept many retail traders overlook is the RSI Range Shift.
Instead of focusing only on 70 and 30, professionals observe the range where RSI spends most of its time.
Bullish Range
Typically:
- 40–90
During healthy uptrends:
- RSI rarely falls below 40.
- Pullbacks often end around 45.
- Momentum quickly recovers.
Bearish Range
Typically:
- 10–60
During sustained downtrends:
- RSI struggles to exceed 60.
- Selling pressure dominates.
- Lower highs continue forming.
Recognizing these range shifts provides an early indication of changing market conditions.
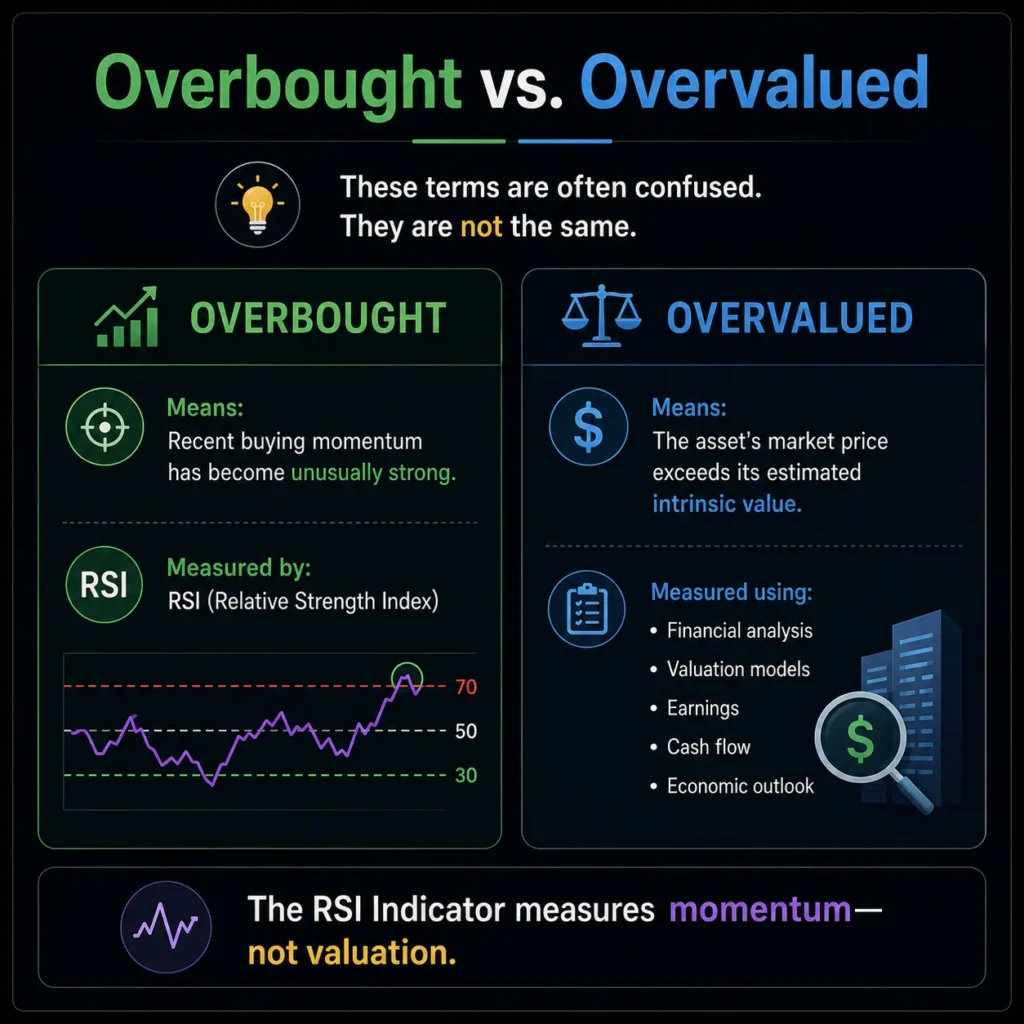
Overbought vs. Overvalued
These terms are often confused.
They are not the same.
Overbought
Means:
Recent buying momentum has become unusually strong.
Measured by RSI.
Overvalued
Means:
The asset’s market price exceeds its estimated intrinsic value.
Measured using:
- Financial analysis
- Valuation models
- Earnings
- Cash flow
- Economic outlook
The RSI Indicator measures momentum—not valuation.
Oversold vs. Undervalued
Similarly:
Oversold simply reflects strong recent selling activity.
It does not indicate that an asset is fundamentally cheap.
For example:
A company facing bankruptcy may remain oversold for months.
Likewise, a high-quality stock can become oversold after temporary market panic, creating a potential opportunity—but fundamentals still matter.
RSI Divergence
One of the most respected applications of The Relative Strength Index (RSI) is divergence analysis.
Divergence occurs when price and momentum no longer move together.
This may signal that the existing trend is weakening.
However, divergence is a warning—not a guarantee of reversal.
Bullish Divergence
Bullish divergence occurs when:
- Price makes a lower low.
- RSI forms a higher low.
This suggests:
Selling pressure is weakening even though price continues falling.
Example
Imagine EUR/USD declines:
- First low: 1.1000
- Second low: 1.0950
Meanwhile:
- First RSI low: 24
- Second RSI low: 31
Price weakened.
Momentum improved.
That discrepancy suggests bearish momentum may be fading.
Bearish Divergence
Bearish divergence is the opposite.
Price:
- Makes a higher high.
RSI:
- Makes a lower high.
Interpretation:
Buyers continue pushing price upward, but momentum no longer supports the move.
This can precede:
- Consolidation
- Pullback
- Trend reversal
Again, confirmation is essential before taking action.
Hidden Divergence
Professional traders also monitor hidden divergences.
These often indicate trend continuation rather than reversal.
Hidden Bullish Divergence
Occurs when:
- Price makes a higher low.
- RSI makes a lower low.
Interpretation:
The overall uptrend remains healthy despite temporary weakness in momentum.
Hidden Bearish Divergence
Occurs when:
- Price makes a lower high.
- RSI makes a higher high.
Interpretation:
The dominant downtrend remains intact.
These signals are especially valuable for traders looking to join an existing trend after a pullback.
Failure Swings
Another advanced RSI concept introduced by J. Welles Wilder is the Failure Swing.
Unlike divergence, failure swings rely solely on RSI behavior rather than comparing RSI with price.
Bullish Failure Swing
A typical sequence looks like this:
- RSI falls below 30.
- RSI rebounds.
- RSI pulls back but remains above 30.
- RSI breaks above the previous high.
This pattern suggests buyers are gradually taking control.
Bearish Failure Swing
The opposite pattern:
- RSI rises above 70.
- RSI declines.
- RSI rallies but fails to exceed the previous high.
- RSI breaks below the prior low.
This indicates weakening bullish momentum.
RSI Centerline Crossovers
Many traders focus exclusively on 70 and 30.
However, the 50 level also provides valuable information.
Bullish Signal
RSI crosses above 50.
Possible interpretation:
Buying momentum is becoming dominant.
Bearish Signal
RSI falls below 50.
Possible interpretation:
Selling pressure is increasing.
Trend-following traders often use these signals alongside moving averages.
Best Timeframes for RSI
One of the strengths of the RSI Indicator is its flexibility.
Different traders use different timeframes depending on their objectives.
Scalping
Popular charts:
- 1 minute
- 3 minute
- 5 minute
Advantages:
- Frequent opportunities
- Fast momentum signals
Disadvantages:
- More market noise
- Higher false signal rate
Day Trading
Popular charts:
- 5 minute
- 15 minute
- 30 minute
Benefits:
- Balanced signal frequency
- Better trend visibility
Swing Trading
Preferred charts:
- 4-hour
- Daily
Advantages:
- Higher-quality signals
- Less emotional trading
- Reduced market noise
Position Trading
Common charts:
- Weekly
- Monthly
Purpose:
Evaluate long-term momentum and major trend shifts.
Combining Multiple Timeframes
Experienced traders rarely analyze only one chart.
Instead, they combine several timeframes.
Example workflow:
Step 1
Identify the overall trend on the Daily chart.
Step 2
Analyze momentum on the 4-hour chart.
Step 3
Fine-tune entries on the 1-hour chart.
This approach helps align trades with the broader market direction while improving entry precision.
Using RSI with Support and Resistance
One of the most reliable ways to improve RSI analysis is to combine it with horizontal support and resistance levels.
Example
Imagine Bitcoin approaches a long-term support zone.
At the same time:
- RSI falls to 28.
- Selling volume decreases.
- A bullish candlestick pattern appears.
Each factor alone provides limited information.
Together, they create a much stronger trading case.
Similarly, if price reaches a major resistance level while RSI enters overbought territory and momentum begins to weaken, traders may prepare for a potential pullback—provided other evidence supports that view.
Using RSI with Trendlines
Trendlines can add another layer of confirmation to RSI analysis.
For example:
- Price respects an ascending trendline.
- RSI remains above 40 during pullbacks.
- A bounce from the trendline coincides with rising RSI.
This alignment suggests that buyers continue to defend the trend.
Conversely, if both the price trendline and RSI support levels break simultaneously, it may indicate that momentum is shifting in favor of sellers.
Using RSI with Candlestick Patterns
Candlestick formations become even more meaningful when supported by momentum analysis.
Examples include:
- Bullish engulfing pattern near support with RSI below 30.
- Hammer candle forming after a prolonged decline while RSI begins rising.
- Shooting star near resistance accompanied by bearish RSI divergence.
- Bearish engulfing candle after RSI exceeds 70.
The combination of price action and the relative strength index often produces higher-quality trading setups than relying on either tool alone.
Common Mistakes When Using the RSI Indicator
Even though the RSI Indicator is straightforward, misuse is extremely common.
Avoid these frequent mistakes:
- Buying solely because RSI is below 30.
- Oversold conditions can persist much longer than expected.
- Selling immediately after RSI crosses above 70.
- Strong trends often remain overbought for extended periods.
- Ignoring the overall trend.
- Countertrend trades generally carry higher risk.
- Using RSI without confirmation.
- Combine it with price action, chart patterns, or support and resistance.
- Changing RSI settings too often.
- Constant optimization can lead to curve fitting and inconsistent results.
- Expecting RSI to predict the future.
- It measures momentum, not certainty.
- Trading every RSI signal.
- Selective, high-quality setups typically outperform frequent trading.