Moving Average (MA): The Complete Guide
Moving Average (MA): The Complete Guide to Understanding, Calculating, and Using Moving Averages in Trading and Analysis
The Moving Average is one of the most widely used technical indicators in financial markets. Whether you are trading stocks, forex, cryptocurrencies, commodities, or analyzing business trends, understanding how a Moving Average works can significantly improve your decision-making process.
At its core, a Moving Average helps smooth out price fluctuations and reveal the underlying trend. Instead of reacting to every short-term market movement, traders and analysts use Moving Averages to identify broader market direction, support and resistance levels, and potential entry and exit points.
Among the most popular variations are the Simple Moving Average (SMA) and the Exponential Moving Average (EMA). While both serve a similar purpose, they differ in how they calculate and weight data, making each suitable for different market conditions and trading styles.
In this comprehensive guide, you’ll learn:
- What a Moving Average is
- Why it matters in trading and investing
- How Moving Averages are calculated
- Differences between Simple Moving Average and Exponential Moving Average
- Common Moving Average strategies
- Advantages and limitations
- Practical examples and professional insights
By the end of this guide, you’ll have a solid understanding of how to effectively use Moving Averages in real-world market analysis.
What Is a Moving Average?
A Moving Average (MA) is a statistical calculation that averages a set of data points over a specified period. In financial markets, these data points are usually closing prices.
As new prices become available, older prices are removed from the calculation, causing the average to “move” over time. This continuous update helps reduce market noise and makes trends easier to identify.
Simple Definition
A Moving Average is an indicator that:
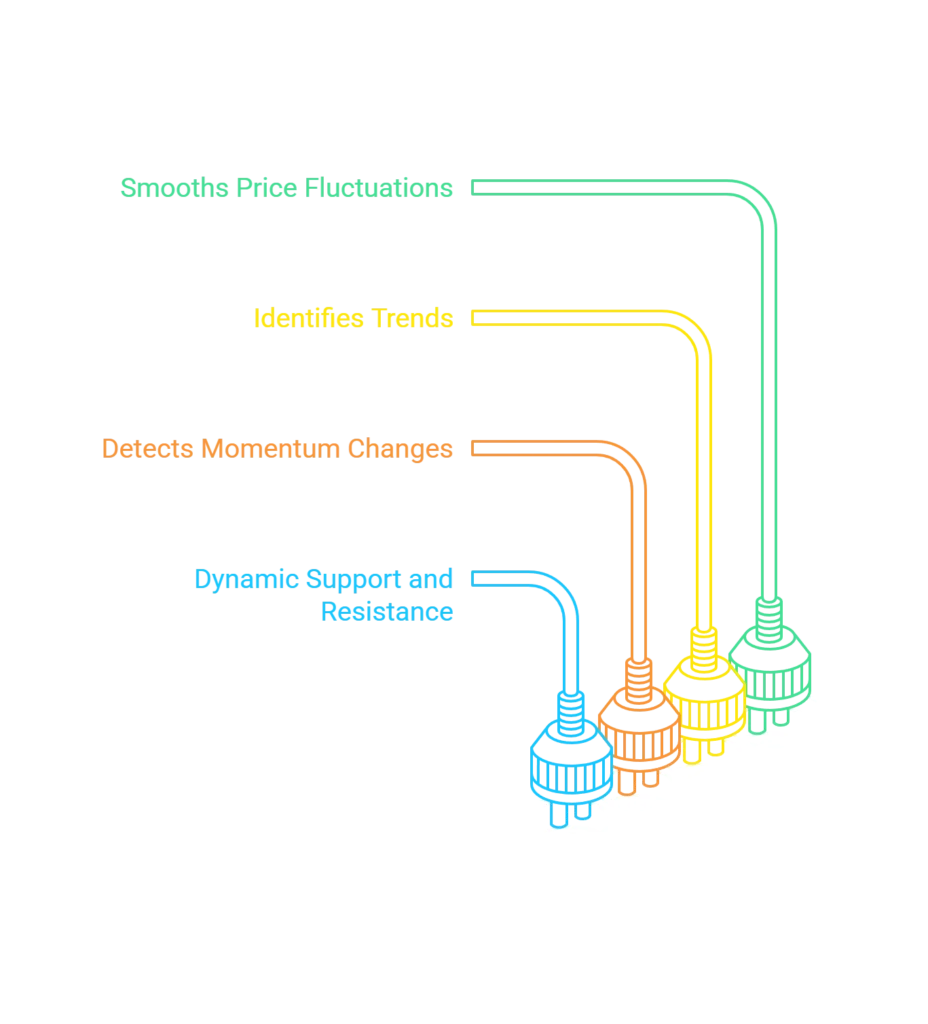
- Smooths price fluctuations
- Identifies trends
- Helps detect momentum changes
- Acts as dynamic support and resistance
For example, if a stock has daily closing prices for the last 20 days, a 20-day Moving Average calculates the average of those prices. Tomorrow, the oldest price drops out and the newest closing price enters the calculation.
The result is a constantly updating average that follows the market.
Why Moving Averages Matter
Financial markets generate enormous amounts of data every second. Looking at raw price movements can be overwhelming because markets rarely move in a straight line.
Moving Averages help traders focus on the bigger picture.
Key Benefits
Trend Identification
One of the primary functions of a Moving Average is identifying market direction.
- Rising MA = Uptrend
- Falling MA = Downtrend
- Flat MA = Sideways market
Noise Reduction
Short-term volatility often creates misleading signals.
Moving Averages filter out much of this noise, making trends more visible.
Support and Resistance
Many traders watch popular Moving Averages such as:
- 20-day MA
- 50-day MA
- 100-day MA
- 200-day MA
As a result, prices often react around these levels.
Trade Confirmation
Instead of relying solely on price action, traders use Moving Averages to confirm trend strength and trading opportunities.
The History of Moving Averages
The concept of averaging data dates back centuries in mathematics and statistics.
However, Moving Averages became particularly popular in financial markets during the 20th century as technical analysis evolved.
As computing technology advanced, traders gained the ability to calculate increasingly sophisticated indicators. Despite the development of complex algorithms and AI-driven trading systems, Moving Averages remain among the most trusted indicators worldwide.
Today, institutional investors, hedge funds, algorithmic traders, and retail investors all incorporate Moving Averages into their analytical frameworks.
How a Moving Average Works
To understand Moving Averages effectively, it’s important to see how they are constructed.
Imagine a stock with the following five closing prices:
Day | Closing Price |
1 | $100 |
2 | $102 |
3 | $104 |
4 | $106 |
5 | $108 |
The 5-day Moving Average would be:
(100 + 102 + 104 + 106 + 108) ÷ 5
= 520 ÷ 5
= 104
The Moving Average value is 104.
On Day 6, suppose the stock closes at $110.
The oldest value ($100) is removed.
The new calculation becomes:
(102 + 104 + 106 + 108 + 110) ÷ 5
= 530 ÷ 5
= 106
The average moves upward as new data enters the calculation.
This process continues continuously.
Understanding the Simple Moving Average (SMA)
The Simple Moving Average (SMA) is the most basic and widely recognized type of Moving Average.
Definition
The SMA calculates the average price over a specific period using equal weighting for all observations.
Every data point contributes equally to the final result.
Formula
SMA = Sum of Prices ÷ Number of Periods
Example
Suppose the closing prices over five days are:
- 50
- 52
- 53
- 55
- 60
Calculation:
(50 + 52 + 53 + 55 + 60) ÷ 5
= 270 ÷ 5
= 54
The 5-day SMA equals 54.
Characteristics of Simple Moving Average
Equal Weight Distribution
Every price carries the same importance.
The oldest price influences the average just as much as the newest price.
Smoother Trend Signals
Because it treats all data equally, SMA often produces smoother trend lines.
Slower Response
The downside is lag.
Since old prices remain influential, SMA reacts more slowly to sudden market changes.
Common SMA Timeframes
Different traders use different SMA periods depending on their objectives.
Short-Term SMA
Examples:
- 5-day SMA
- 10-day SMA
- 20-day SMA
Used for:
- Day trading
- Swing trading
- Momentum strategies
Medium-Term SMA
Examples:
- 50-day SMA
- 100-day SMA
Used for:
- Position trading
- Intermediate trend analysis
Long-Term SMA
Examples:
- 200-day SMA
- 300-day SMA
Used for:
- Long-term investing
- Market cycle analysis
Real-World Example of SMA Usage
Imagine a stock trading above its 200-day SMA.
Many investors interpret this as a sign that the long-term trend remains bullish.
Conversely, if the stock falls below the 200-day SMA, investors may view it as evidence of weakening momentum.
Institutional investors often monitor these levels closely, making them psychologically important market zones.
Understanding the Exponential Moving Average (EMA)
The Exponential Moving Average (EMA) is another highly popular Moving Average type.
Unlike the SMA, the EMA gives more weight to recent prices.
This makes it more responsive to market changes.
Why Was EMA Developed?
Traders recognized a major limitation of the SMA:
Older data influences the average just as much as recent data.
However, recent prices are usually more relevant to current market conditions.
EMA addresses this issue by emphasizing newer information.
How Exponential Moving Average Works
The EMA uses a weighting multiplier.
Recent prices receive greater influence while older prices gradually lose significance.
This allows EMA to react faster to:
- Trend reversals
- Breakouts
- Momentum shifts
- Volatility changes

EMA Formula
The formula consists of two steps.
Step 1: Calculate the Multiplier
Multiplier = 2 ÷ (Period + 1)
For a 10-day EMA:
Multiplier = 2 ÷ (10 + 1)
= 0.1818
Step 2: Calculate EMA
EMA = Current Price × Multiplier + Previous EMA × (1 − Multiplier)
Although software performs these calculations automatically, understanding the logic helps traders interpret EMA behavior.
Characteristics of Exponential Moving Average
Faster Reaction Speed
EMA adapts quickly when prices change.
More Sensitive Signals
Because recent prices receive greater weight, EMA often detects trend changes sooner.
Increased Noise
The trade-off is that EMA may generate more false signals in choppy markets.
Practical EMA Example
Suppose a stock suddenly rises 10% after strong earnings.
An EMA will respond much faster than an SMA because it places greater emphasis on the latest prices.
As a result:
- EMA may identify a trend reversal sooner
- Traders receive earlier signals
- Opportunities may be captured faster
However, false breakouts can also trigger premature entries.
Simple Moving Average vs Exponential Moving Average
One of the most common questions among traders is whether to use SMA or EMA.
The answer depends on trading goals.
Key Differences
Feature | SMA | EMA |
Weighting | Equal | Recent prices weighted more |
Speed | Slower | Faster |
Noise Reduction | Better | Less |
Trend Detection | Delayed | Earlier |
False Signals | Fewer | More |
Popular Use | Long-term trends | Short-term trading |
When to Use SMA
SMA works best when:
- Analyzing long-term trends
- Avoiding market noise
- Confirming major market direction
- Investing rather than active trading
Examples:
- 50-day SMA
- 100-day SMA
- 200-day SMA
When to Use EMA
EMA works best when:
- Trading actively
- Monitoring momentum
- Seeking early trend signals
- Trading volatile markets
Examples:
- 9 EMA
- 12 EMA
- 20 EMA
- 21 EMA
Which Moving Average Is Better?
There is no universal winner.
Professional traders often use both.
For example:
- EMA for entries
- SMA for long-term trend confirmation
This combination provides a balanced approach between responsiveness and reliability.
Popular Moving Average Periods Used by Traders
Choosing the right period significantly impacts results.
Here are some commonly used Moving Average settings.
9-Period MA
Often used by:
- Scalpers
- Day traders
Benefits:
- Fast signals
- High responsiveness
Drawback:
- Increased noise
20-Period MA
Commonly used for:
- Swing trading
- Trend following
Benefits:
- Good balance between speed and stability
50-Period MA
Widely followed across markets.
Benefits:
- Reliable medium-term trend indicator
- Popular support and resistance level
100-Period MA
Used to identify:
- Intermediate trends
- Market transitions
200-Period MA
One of the most important Moving Averages in finance.
Benefits:
- Long-term trend filter
- Institutional benchmark
- Strong psychological significance
How Traders Interpret Moving Average Direction
A Moving Average’s slope often reveals more information than its exact value.
Upward Slope
Indicates:
- Increasing prices
- Bullish momentum
- Positive trend strength
Downward Slope
Indicates:
- Declining prices
- Bearish momentum
- Selling pressure
Flat Slope
Indicates:
- Consolidation
- Market indecision
- Range-bound conditions
Understanding slope analysis helps traders avoid trading against dominant market trends.
Moving Average Crossover Strategies
Among all technical trading methods, Moving Average crossovers are arguably the most popular. They are simple to understand, easy to implement, and can be adapted to virtually any market.
A crossover occurs when one Moving Average moves above or below another Moving Average. Traders interpret these events as potential signals that market momentum is changing.
Why Crossovers Work
Markets tend to move in trends. During strong trends, shorter-term Moving Averages react faster than longer-term Moving Averages.
When the short-term average changes direction significantly enough, it may cross the longer-term average, signaling a shift in market sentiment.
Think of it as the market gradually changing gears.
The Golden Cross
The Golden Cross is one of the most recognized bullish signals in technical analysis.
What Is a Golden Cross?
A Golden Cross occurs when:
- A shorter-term Moving Average rises above a longer-term Moving Average.
- The most common setup is the 50-day SMA crossing above the 200-day SMA.
What It Suggests
A Golden Cross typically indicates:
- Increasing bullish momentum
- Growing investor confidence
- Potential long-term uptrend
Example
Imagine a stock that has been trading sideways for months.
As buying pressure increases:
- The 50-day SMA begins rising.
- It eventually crosses above the 200-day SMA.
- Traders view this as a bullish confirmation.
Many institutional investors pay close attention to this signal because it often reflects a significant shift in market sentiment.
Important Note
A Golden Cross does not guarantee higher prices.
It simply suggests that the probability of a sustained uptrend may be increasing.
The Death Cross
The opposite of the Golden Cross is the Death Cross.
What Is a Death Cross?
A Death Cross occurs when:
- A shorter-term Moving Average falls below a longer-term Moving Average.
- Commonly the 50-day SMA crosses below the 200-day SMA.
What It Suggests
This pattern often signals:
- Weakening momentum
- Increasing selling pressure
- Potential long-term downtrend
Example
Suppose a stock has been declining steadily.
As losses accumulate:
- The 50-day SMA trends lower.
- It eventually falls below the 200-day SMA.
- Many traders interpret this as bearish confirmation.
Major market corrections have frequently been preceded by Death Cross signals, although false signals can still occur.
Short-Term EMA Crossover Strategy
Many active traders prefer faster indicators.
One common method uses:
- 9 EMA
- 21 EMA
Bullish Signal
Occurs when:
9 EMA crosses above 21 EMA.
Possible interpretation:
- Momentum is accelerating upward.
- Buyers may be gaining control.
Bearish Signal
Occurs when:
9 EMA crosses below 21 EMA.
Possible interpretation:
- Momentum is weakening.
- Sellers may be taking control.
Advantages
- Earlier signals
- Better for active traders
- Effective in trending markets
Disadvantages
- More false signals
- Less effective during consolidation
Triple Moving Average Strategy
Some traders use three Moving Averages to reduce false signals.
Example Setup
- 20 EMA
- 50 EMA
- 200 SMA
Bullish Structure
When:
- 20 EMA above 50 EMA
- 50 EMA above 200 SMA
This alignment suggests strong trend strength.
Bearish Structure
When:
- 20 EMA below 50 EMA
- 50 EMA below 200 SMA
This alignment suggests significant weakness.
Using multiple averages helps traders assess trend quality rather than relying on a single crossover.
Moving Average as Dynamic Support and Resistance
Many beginners focus only on crossover signals.
However, professional traders often use Moving Averages as dynamic support and resistance levels.
Dynamic vs Static Levels
Static support and resistance remain fixed.
Examples:
- Previous highs
- Previous lows
- Key price zones
Dynamic support and resistance move with price.
Moving Averages are among the most widely used dynamic levels.
Support During Uptrends
In strong uptrends, price often pulls back toward a Moving Average before continuing higher.
Common examples:
- 20 EMA
- 50 SMA
Traders frequently watch these levels for potential buying opportunities.
Example
Suppose a stock rises from $100 to $140.
Price then retraces to the 50-day SMA.
If buyers enter aggressively at this level, the Moving Average effectively acts as support.
Resistance During Downtrends
In bearish markets, Moving Averages often act as resistance.
Price may rally toward the average before resuming its decline.
Example
A stock falls from $200 to $150.
Price rebounds toward the 50-day SMA.
Selling pressure emerges near the average.
The Moving Average acts as resistance.
Why These Levels Matter
Moving Averages become self-reinforcing because millions of traders monitor them.
When enough market participants expect a reaction near a Moving Average:
- Buying orders accumulate
- Selling orders accumulate
- Price reactions become more likely
This collective behavior increases the indicator’s effectiveness.
Trend Following with Moving Averages
Trend following remains one of the most successful trading philosophies ever developed.
The core principle is simple:
Trade in the direction of the dominant trend.
Moving Averages help identify that trend.
Basic Trend Filter
A straightforward approach uses a single long-term Moving Average.
Bullish Condition
Price above 200-day SMA.
Bearish Condition
Price below 200-day SMA.
Trading Rule
Some traders only take:
- Long trades above the 200 SMA
- Short trades below the 200 SMA
This simple filter can dramatically improve discipline.
Multi-Timeframe Analysis
Professional traders rarely rely on a single chart.
Instead, they combine multiple timeframes.
Example
Long-Term Trend:
- Daily chart
- 200 SMA
Intermediate Trend:
- 4-hour chart
- 50 SMA
Entry Timing:
- 1-hour chart
- 20 EMA
This layered approach provides a broader market perspective.
Moving Average Pullback Strategy
One of the most reliable ways to trade trends involves waiting for pullbacks.
Instead of chasing price, traders wait for temporary retracements toward a Moving Average.
Bullish Pullback Setup
Requirements:
- Strong uptrend
- Price above 50 SMA
- Temporary decline toward Moving Average
- Bullish price action confirmation
Why It Works
Strong trends rarely move in a straight line.
Temporary pullbacks allow traders to enter at more favorable prices.
Example Scenario
Imagine:
- Stock trades at $50.
- Rallies to $70.
- Pulls back to the 20 EMA.
- Buyers return.
This creates a potentially attractive entry opportunity while maintaining trend alignment.
Combining Moving Averages with Other Indicators
Moving Averages become significantly more effective when combined with complementary indicators.
No indicator should operate in isolation.
Moving Average + RSI
The Relative Strength Index (RSI) measures momentum.
Bullish Setup
Conditions:
- Price above 200 SMA
- RSI rebounds from oversold conditions
- Trend remains intact
This combination helps identify pullback opportunities.
Moving Average + MACD
The Moving Average Convergence Divergence (MACD) is itself built using Exponential Moving Averages.
Combining trend direction from Moving Averages with MACD momentum confirmation can strengthen trade signals.
Example
- Price above 50 SMA
- MACD bullish crossover
- Increasing volume
Together these factors create stronger evidence of trend continuation.
Moving Average + Volume Analysis
Volume confirms conviction.
Strong Bullish Signal
- Price above Moving Average
- Rising volume
- Upward-sloping MA
This suggests broad market participation.
Weak Bullish Signal
- Price above MA
- Falling volume
The trend may lack sustainability.
Moving Average + Price Action
Many experienced traders prioritize price action.
Moving Averages serve as supporting evidence.
Example
A bullish engulfing candle forms directly on the 50 EMA.
This alignment provides:
- Trend confirmation
- Support confirmation
- Entry confirmation
The confluence increases confidence.
Best Markets for Moving Average Trading
Moving Averages can be applied across virtually every financial market.
Stock Market
Popular uses include:
- Long-term trend analysis
- Swing trading
- Institutional investing
Common settings:
- 50 SMA
- 200 SMA
Forex Market
Currency traders frequently use:
- 20 EMA
- 50 EMA
Benefits include:
- Trend identification
- Momentum analysis
- Trade filtering
Cryptocurrency Market
Crypto markets are highly volatile.
Many traders rely heavily on EMAs because they respond more quickly to rapid price changes.
Popular choices:
- 20 EMA
- 50 EMA
- 200 EMA
Commodity Markets
Moving Averages assist traders in:
- Gold trading
- Oil trading
- Agricultural futures
Long-term trend recognition is particularly valuable in commodity cycles.
Common Moving Average Mistakes
Many traders misuse Moving Averages.
Understanding common mistakes can significantly improve results.
Using Moving Averages Alone
No indicator is perfect.
Relying solely on Moving Averages increases risk.
Always incorporate:
- Market structure
- Volume
- Risk management
- Additional confirmation
Ignoring Market Conditions
Moving Averages perform best in trending markets.
They often struggle during:
- Consolidation
- Sideways movement
- Low volatility periods
Recognizing market conditions is essential.
Chasing Late Signals
Because Moving Averages are lagging indicators, signals often occur after trends have already begun.
Many traders enter too late.
Solution:
Use Moving Averages for confirmation rather than prediction.
Choosing Inappropriate Timeframes
A 5-period Moving Average behaves very differently from a 200-period Moving Average.
Match the indicator to your trading horizon.
Advantages of Moving Averages
Moving Averages remain popular because they offer numerous benefits.
Simplicity
Easy to understand and implement.
Versatility
Applicable across:
- Stocks
- Forex
- Crypto
- Commodities
- Economic data
Trend Identification
Excellent for spotting market direction.
Risk Reduction
Helps traders avoid trading against dominant trends.
Automation Friendly
Widely used in algorithmic and quantitative trading systems.
Limitations of Moving Averages
Despite their usefulness, Moving Averages are not flawless.
Lagging Nature
They react after price moves.
They do not predict future prices.
False Signals
Whipsaws occur frequently in ranging markets.
Parameter Sensitivity
Different settings can produce vastly different results.
Market Dependence
Performance varies across asset classes and market environments.

Advanced Moving Average Concepts
As traders gain experience, they often explore more sophisticated applications.
Adaptive Moving Averages
These adjust automatically based on volatility.
Examples include:
- Kaufman’s Adaptive Moving Average (KAMA)
- Variable Moving Average (VMA)
Weighted Moving Average (WMA)
A Weighted Moving Average assigns greater importance to recent data, similar to an EMA but using a different calculation methodology.
Hull Moving Average (HMA)
Designed to reduce lag while maintaining smoothness.
Many active traders prefer HMA for trend identification.
Moving Average Ribbon
A ribbon consists of multiple Moving Averages plotted simultaneously.
Example:
- 10 EMA
- 20 EMA
- 30 EMA
- 40 EMA
- 50 EMA
This visualization helps assess trend strength and momentum.
How Professional Traders Use Moving Averages
Professional traders rarely use Moving Averages as standalone buy-and-sell signals.
Instead, they use them to answer key questions:
- What is the dominant trend?
- Is momentum increasing or decreasing?
- Where might support or resistance appear?
- Are buyers or sellers currently in control?
- Does the trade align with broader market conditions?
By focusing on context rather than mechanical signals, professionals extract significantly more value from Moving Averages.
Conclusion
The Moving Average remains one of the most effective and widely used tools in technical analysis. Its ability to smooth price fluctuations, identify trends, and provide objective market insights makes it invaluable for traders and investors alike.
Both the Simple Moving Average (SMA) and Exponential Moving Average (EMA) offer unique advantages. The SMA excels at filtering noise and highlighting long-term trends, while the EMA responds more quickly to recent market developments.
When combined with proper risk management, volume analysis, price action, and broader market context, Moving Averages can become a powerful component of a well-rounded trading strategy.
The key is not to view Moving Averages as prediction tools, but rather as trend-following instruments that help traders make more informed and disciplined decisions.
A Moving Average is a technical indicator that calculates the average price of an asset over a specified period, helping traders identify trends and reduce market noise.
A Simple Moving Average gives equal weight to all prices in the calculation, while an Exponential Moving Average places greater emphasis on recent prices, making it more responsive to market changes.
The 50-day SMA and 200-day SMA are often recommended for beginners because they provide clear trend signals and are widely used across financial markets.
Neither is universally better. EMA reacts faster and is preferred by active traders, while SMA provides smoother signals and is often favored for long-term trend analysis.
The 200-day Moving Average is widely considered one of the most important indicators because it is closely monitored by institutional investors and often defines long-term market trends.