
Smart Money in Forex
Smart Money in Forex: How Institutional Trading Concepts Work
Introduction
If you have spent any time studying financial markets, you have probably heard traders talk about smart money. The term appears everywhere—from forex trading communities and technical analysis courses to discussions about institutional order flow, liquidity, market structure, and price manipulation.
But what does smart money actually mean?
In simple terms, smart money refers to capital controlled by professional or highly informed market participants, such as banks, institutional investors, hedge funds, asset managers, proprietary trading firms, and other large market participants. In the forex market, these participants can execute orders large enough that liquidity becomes a critical part of how they enter and exit positions.
This is where smart money analysis becomes interesting.
Instead of looking at a chart only through traditional indicators such as moving averages, RSI, or MACD, traders using smart money concepts often ask different questions:
- Where is liquidity likely concentrated?
- Where are traders placing their stop-loss orders?
- Has the market structure changed?
- Which price levels previously triggered aggressive buying or selling?
- Where might large orders have been executed?
- Is a breakout genuine, or is price simply moving toward available liquidity?
- Where is price trading relative to an important range?
These questions create a very different way of reading a forex chart.
However, smart money trading is also surrounded by myths. Institutions do not all trade using one secret strategy, and no chart pattern can reveal exactly what a bank is doing. Terms such as order blocks, liquidity sweeps, fair value gaps, displacement, and break of structure are analytical frameworks—not guaranteed windows into institutional positions.
Understanding that distinction is essential.
This guide explains the logic behind smart money concepts, how they can be applied to forex trading, where the approach can be useful, and where traders should remain skeptical.
What Is Smart Money?
The phrase smart money traditionally describes capital managed by market participants believed to have greater information, resources, technology, experience, or market access than the average retail trader.
Depending on the financial market, smart money may include:
- Commercial and investment banks
- Hedge funds
- Asset management companies
- Pension funds
- Insurance companies
- Proprietary trading firms
- Large institutional investors
- Market makers and liquidity providers
Not every institutional participant is trying to accomplish the same objective.
A hedge fund might speculate on changes in interest-rate expectations. An international corporation may exchange currencies to hedge future revenue. A pension fund could rebalance international assets. A market maker may primarily facilitate transactions rather than maintain a long-term directional view.
This is important because one common misconception about smart money is that all large institutions somehow cooperate to move the market in a particular direction.
They do not.
The forex market is an enormous decentralized marketplace containing participants with different objectives, time horizons, information, and risk exposures.
What large participants do share, however, is an important problem:
Size.
A retail trader may be able to buy or sell a position almost instantly without meaningfully affecting the market.
A large institution attempting to execute a much larger position has a different challenge. It needs sufficient liquidity on the opposite side of its transactions.
That fundamental reality is one reason liquidity plays such an important role in smart money analysis.
Why Smart Money Matters in Forex
The foreign exchange market is especially relevant to smart money concepts because of its enormous scale and institutional participation.
Forex trading occurs across a global network of banks, brokers, financial institutions, corporations, governments, funds, and individual traders rather than through one centralized exchange.
Major currencies such as:
- EUR/USD
- GBP/USD
- USD/JPY
- USD/CHF
- AUD/USD
- USD/CAD

typically have deep liquidity, particularly during active trading sessions.
Institutional activity matters because large transactions can influence short-term order flow and contribute to significant price movements.
But there is an important nuance.
Retail traders normally cannot see the complete global forex order book.
Unlike a centralized exchange where market participants can analyze a unified stream of transactions, spot forex liquidity is fragmented across different banks, electronic communication networks, brokers, liquidity providers, and trading venues.
Therefore, smart money traders generally infer institutional behavior from price action and market structure rather than observing every institutional order directly.
That means smart money concepts should be treated as a framework for interpreting market behavior—not as proof of hidden institutional activity.
Smart Money vs Traditional Retail Trading
Traditional retail technical analysis often focuses on indicators and recognizable chart patterns.
For example, a trader might buy because:
- RSI becomes oversold.
- Price crosses above a moving average.
- MACD generates a bullish crossover.
- A trendline breaks.
- A bullish candlestick pattern appears.
A smart money trader may look at the same market differently.
Instead of immediately asking whether an indicator says “buy” or “sell,” the trader might examine:
- The higher-timeframe trend or dealing range.
- Important swing highs and lows.
- Areas containing potential liquidity.
- Whether price swept one of those areas.
- Whether strong displacement followed.
- Whether market structure subsequently shifted.
- Whether price returned to a relevant zone for a possible entry.
Neither approach automatically guarantees better performance.
The major difference is the framework used to interpret price.
Smart money concepts attempt to understand why price might move toward particular levels and how liquidity may influence those movements.
The Foundation of Smart Money Trading: Market Structure
Before studying order blocks, fair value gaps, or liquidity sweeps, traders need to understand market structure.
Market structure describes the sequence of highs and lows created by price.
At its simplest, markets can generally be classified as:
- Bullish
- Bearish
- Ranging or consolidating
Bullish Market Structure
A bullish trend typically creates a sequence of:
Higher High → Higher Low → Higher High → Higher Low
Imagine EUR/USD moving like this:
- Price rises from 1.0800 to 1.0900.
- It retraces to 1.0850.
- It rallies to 1.0970.
- It retraces to 1.0910.
- It continues toward 1.1030.
The sequence of higher highs and higher lows suggests buyers remain structurally dominant.
Smart money traders usually pay particular attention to the swing lows responsible for producing new highs.
If an important protected low eventually fails, the bullish structure may be weakening.
Bearish Market Structure
A bearish trend works in reverse:
Lower Low → Lower High → Lower Low → Lower High
Suppose GBP/USD moves:
- From 1.2800 down to 1.2700.
- Back to 1.2760.
- Down to 1.2630.
- Back to 1.2690.
- Down toward 1.2550.
This sequence indicates bearish structure.
Traders then monitor important swing highs. A decisive break above a significant high can indicate that bearish momentum is weakening or that market conditions are changing.
Ranging Markets
Not every forex market trends cleanly.
Price often consolidates between recognizable boundaries.
For example:
Resistance: 1.1050
Support: 1.0950
Price may repeatedly move between these levels.
Ranges are particularly interesting from a liquidity perspective because repeated highs and lows can attract orders around their boundaries.
A breakout beyond the range does not necessarily guarantee continuation. Price may temporarily move beyond one boundary, capture liquidity, and then return inside the range.
This behavior leads directly to one of the most important smart money concepts.
Understanding Liquidity in Smart Money Trading
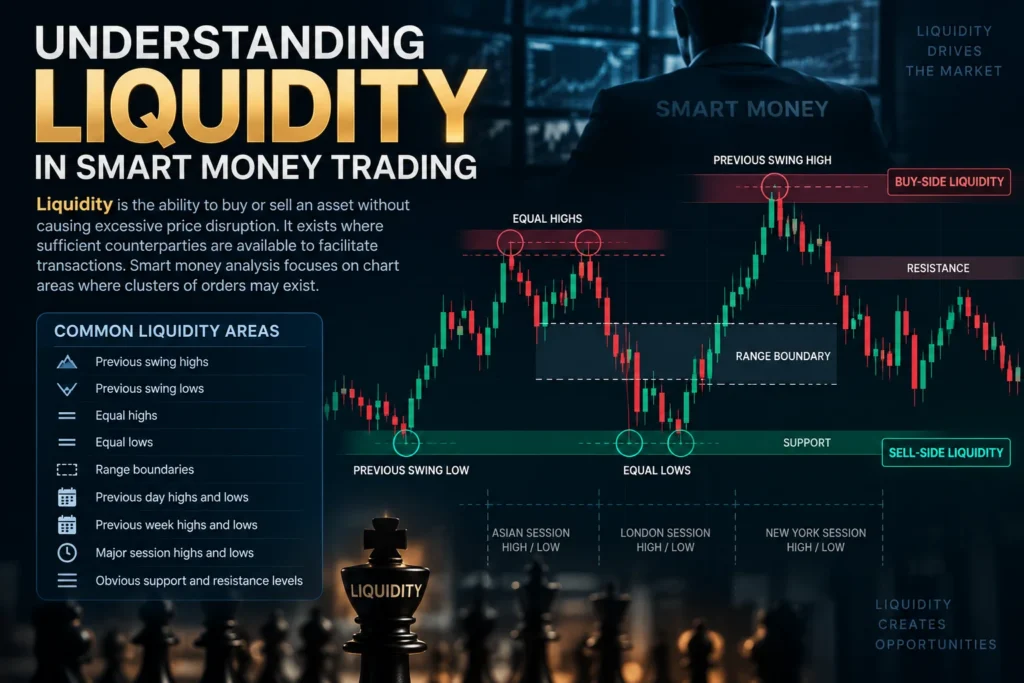
Liquidity is the ability to buy or sell an asset without causing excessive price disruption.
In practical trading terms, liquidity exists where sufficient counterparties are available to facilitate transactions.
Smart money analysis often focuses on chart areas where clusters of orders may exist.
Common liquidity areas include:
- Previous swing highs
- Previous swing lows
- Equal highs
- Equal lows
- Range boundaries
- Previous day highs and lows
- Previous week highs and lows
- Major session highs and lows
- Obvious support and resistance levels
Why are these locations important?
Because many traders make similar decisions around obvious technical levels.
Suppose EUR/USD repeatedly fails around 1.1000.
Retail traders may see resistance and enter short positions near that level.
Where might they place their stop losses?
Perhaps at:
1.1010
1.1020
1.1030
Meanwhile, breakout traders may place buy-stop orders slightly above 1.1000.
As a result, the area above the repeated highs can contain a concentration of orders.
Smart money traders often call this buy-side liquidity.
Buy-Side and Sell-Side Liquidity
Two terms appear constantly in smart money trading:
Buy-Side Liquidity
Buy-side liquidity generally refers to areas above existing highs where buy orders may be triggered.
Potential sources include:
- Stop losses from short positions
- Buy-stop breakout orders
- Orders positioned above swing highs
- Orders above equal highs
For example, imagine EUR/USD forms three similar highs around 1.0920.
Many traders see strong resistance.
Short sellers enter near 1.0920 and place stop losses around 1.0930–1.0940.
Price later trades above 1.0920.
Those stops become market buy orders when triggered.
This creates available liquidity.
Sell-Side Liquidity
Sell-side liquidity typically exists below important lows.
Potential orders include:
- Stop losses from long positions
- Sell-stop breakout orders
- Orders below equal lows
- Orders beneath significant support
Suppose GBP/USD forms repeated lows near 1.2500.
Long traders may buy the support area and place their stops below 1.2500.
Breakout traders may simultaneously prepare sell-stop orders beneath the same level.
Price moving below the lows can trigger both types of orders.
This concentration is often described as sell-side liquidity.
What Is a Liquidity Sweep?
A liquidity sweep occurs when price trades beyond a recognizable high or low, triggers orders around that level, and then reacts.
You may also hear traders use terms such as:
- Liquidity grab
- Stop hunt
- Stop run
- False breakout
These expressions are often used interchangeably, although individual trading methodologies may define them differently.
Consider this simplified forex example.
EUR/USD forms equal highs at 1.1050.
Price rallies to:
1.1065
Breakout buyers enter.
Stops from short positions are triggered.
But instead of continuing higher, EUR/USD rapidly falls back below 1.1050 and begins trading toward 1.1000.
A smart money trader might interpret this as a sweep of buy-side liquidity.
However, one critical principle should be remembered:
A liquidity sweep alone is not automatically a trading signal.
Price can take liquidity above a high and continue moving higher.
Therefore, experienced traders usually look for additional confirmation.
That may include:
- Strong rejection
- Displacement
- Market structure shift
- Break of a significant swing
- Return to an imbalance
- Higher-timeframe directional alignment
Context matters more than the sweep itself.
Liquidity Is Not the Same as Manipulation
This distinction is essential for anyone learning smart money trading.
Social media explanations sometimes imply that every stop-loss sweep occurs because “the banks are hunting retail traders.”
That is an oversimplification.
Markets naturally move toward areas containing executable orders because transactions require counterparties.
A move through a previous high may result from:
- Genuine buying pressure
- Algorithmic execution
- Institutional rebalancing
- News
- Stop orders being triggered
- Hedging activity
- Momentum strategies
- Thin liquidity
- A combination of several factors
Without access to complete institutional order-flow data, a trader usually cannot know exactly why every price movement occurred.
A more disciplined interpretation is:
Price traded into an area where liquidity was likely concentrated, then demonstrated a measurable reaction.
That statement is based on observable price behavior rather than an unprovable narrative.
What Is a Break of Structure (BOS)?
A Break of Structure, commonly abbreviated as BOS, occurs when price decisively breaks an important structural high or low.
In a bullish trend, traders generally look for price to break above a previous significant high.
In a bearish trend, they look for a break below an important low.
Bullish BOS Example
Suppose EUR/USD creates:
- Low: 1.0800
- High: 1.0900
- Higher low: 1.0850
Price then rallies through 1.0900 and reaches 1.0950.
Breaking the previous high can be classified as a bullish break of structure.
This suggests bullish continuation remains intact.
Bearish BOS Example
Suppose GBP/USD creates:
- High: 1.2800
- Low: 1.2700
- Lower high: 1.2760
Price then falls below 1.2700.
That move may represent a bearish BOS and support continuation of the existing bearish structure.
The important word here is significant.
If traders classify every tiny candle high and low as structural, the chart quickly becomes meaningless.
Swing significance should be determined consistently based on timeframe and trading strategy.
Market Structure Shift and Change of Character
Smart money communities use several terms to describe potential changes in directional behavior.
Two common expressions are:
Market Structure Shift (MSS)
and
Change of Character (CHoCH)
Definitions vary between trading educators, but the basic idea is similar: price violates a structural point that had previously supported the existing trend.
Imagine a bearish forex market creating:
Lower High → Lower Low → Lower High → Lower Low
Then price sweeps a significant low and aggressively rallies above the latest meaningful lower high.
That behavior may indicate that sellers are losing control.
A trader could interpret the move as an early sign of a transition from bearish to bullish conditions.
But again, it is not guaranteed.
Markets frequently create temporary structural shifts before returning to their previous direction.
This is why smart money analysis often combines market structure with liquidity and displacement.
What Is Displacement?
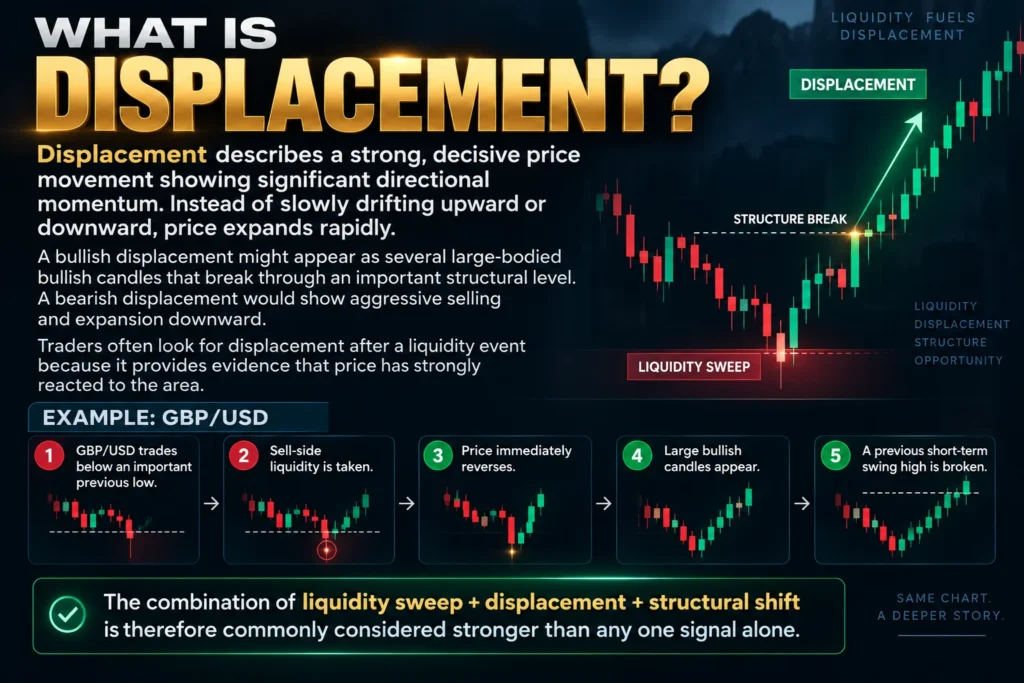
Displacement describes a strong, decisive price movement showing significant directional momentum.
Instead of slowly drifting upward or downward, price expands rapidly.
A bullish displacement might appear as several large-bodied bullish candles that break through an important structural level.
A bearish displacement would show aggressive selling and expansion downward.
Traders often look for displacement after a liquidity event because it provides evidence that price has strongly reacted to the area.
For example:
- GBP/USD trades below an important previous low.
- Sell-side liquidity is taken.
- Price immediately reverses.
- Large bullish candles appear.
- A previous short-term swing high is broken.
This sequence provides considerably more information than simply observing that the low was briefly breached.
The combination of liquidity sweep + displacement + structural shift is therefore commonly considered stronger than any one signal alone.
Fair Value Gaps and Market Imbalance
One of the most recognizable concepts in smart money trading is the Fair Value Gap (FVG).
A fair value gap refers to an area created during rapid price expansion where trading activity appears relatively inefficient or imbalanced.
Traders commonly identify it using a three-candle sequence.
Bullish Fair Value Gap
Consider three candles:
Candle 1 → Candle 2 → Candle 3
Candle 2 produces strong bullish expansion.
If the high of Candle 1 remains below the low of Candle 3, an area exists between those prices that was crossed quickly during the move.
Smart money traders may identify this zone as a bullish FVG.
Bearish Fair Value Gap
The opposite applies during aggressive bearish movement.
If the low of Candle 1 is above the high of Candle 3, the gap between those points may be classified as a bearish FVG.
Why Traders Watch Fair Value Gaps
The underlying theory is that aggressive movement created an imbalance between buyers and sellers.
Price may later revisit part of that area before continuing.
For example:
EUR/USD rallies aggressively from 1.0800 toward 1.0900 and creates a bullish FVG between approximately 1.0835 and 1.0850.
Instead of buying at 1.0900 after the expansion has already occurred, a trader might wait to see whether price retraces toward the imbalance.
If price returns to the zone while the broader bullish structure remains valid, the area may provide a more attractive location for evaluating a long setup.
However:
Not every fair value gap gets filled.
And price does not have to respect an FVG simply because one exists.
Fair value gaps become more useful when combined with market context.
What Is an Order Block?
An order block is another core smart money concept.
In simplified terms, traders use the term to describe a price area associated with the origin of a significant directional move.
A commonly used definition is:
Bullish order block: the final bearish candle or bearish price area before a strong bullish displacement.
Bearish order block: the final bullish candle or bullish price area before a strong bearish displacement.
But identifying every opposite-colored candle before a move as an order block is a common beginner mistake.
A higher-quality order block is usually associated with meaningful market behavior.
For example, traders may look for an area that:
- Preceded strong displacement
- Led to a break of market structure
- Appeared after a liquidity sweep
- Created a fair value gap
- Remains relevant to higher-timeframe structure
This filtering process helps eliminate many random zones.
Real-World Forex Example: Combining Smart Money Concepts
Consider a hypothetical GBP/USD scenario.
The market has been bullish on the four-hour chart.
Price then begins retracing.
A previous significant low exists at:
1.2650
Below this level, traders expect sell-side liquidity.
GBP/USD falls to:
1.2635
The previous low is broken.
At first glance, this looks bearish.
But price quickly reverses.
A large bullish candle pushes the market back above 1.2650.
The rally continues and breaks a short-term swing high at 1.2700.
During this expansion, a bullish fair value gap forms between 1.2670 and 1.2685.
Now the trader has several pieces of information:
- Higher-timeframe context was bullish.
- Sell-side liquidity below 1.2650 was swept.
- Price rejected the lower area.
- Bullish displacement appeared.
- Short-term bearish structure was broken.
- A bullish imbalance was created.
Instead of buying immediately after the rally, the trader could wait for a retracement toward the FVG or another relevant demand area.
A hypothetical trade plan might look like:
Entry zone: 1.2670–1.2685
Invalidation: Below the liquidity-sweep low
Potential target: Previous high / buy-side liquidity
Notice the difference between this approach and blindly buying an order block.
The trade idea is based on a sequence of events.
That sequence is one of the most important principles in smart money analysis.
The Importance of Higher-Timeframe Context
A five-minute chart can produce dozens of apparent liquidity sweeps, order blocks, fair value gaps, and structural breaks every day.
Trying to trade all of them usually creates confusion.
Higher-timeframe analysis helps provide context.
Many forex traders use a top-down process.
For example:
Daily → 4H → 1H → 15M
The daily chart provides broader context.
The four-hour chart identifies major structure.
The one-hour chart helps refine important areas.
The 15-minute chart may then be used for execution.
A trader could ask:
- Is the daily market bullish, bearish, or ranging?
- Where are the major highs and lows?
- Where is obvious liquidity?
- Has price entered an important higher-timeframe area?
- What does lower-timeframe structure show?
- Is there evidence of rejection or continuation?
This prevents traders from treating every lower-timeframe pattern equally.
Premium and Discount Zones
Smart money traders often divide a price range into two broad areas:
Premium
and
Discount
Imagine price creates a range between:
Low: 1.0800
and
High: 1.1000
The midpoint is:
1.0900
Prices below the midpoint are considered the discount portion of the range.
Prices above it are considered the premium portion.
Conceptually:
1.1000 — Range High
1.0900 — Equilibrium / 50%
1.0800 — Range Low
If the broader expectation is bullish, traders may prefer searching for buying opportunities in discount rather than chasing price near the top of the range.
If the expectation is bearish, they may prefer evaluating shorts in premium.
This is not a mechanical rule.
Price can continue rallying while already in premium, just as it can continue falling while trading in discount.
The concept is primarily a way of evaluating location.
Why Location Matters More Than Patterns
Imagine two identical bullish fair value gaps.
The first appears directly underneath a major weekly resistance level after an extended rally.
The second appears after price sweeps a major daily low, enters a higher-timeframe discount zone, and generates strong bullish displacement.
Technically, both charts contain a bullish FVG.
But their contexts are completely different.
This illustrates a fundamental smart money principle:
A pattern without context has limited value.
Before taking a setup, consider:
- Higher-timeframe direction
- Current dealing range
- Nearby liquidity
- Structural conditions
- Session timing
- Volatility
- Economic events
- Risk-to-reward potential
- Invalidation point
The goal is not to collect as many smart money terms as possible.
The goal is to understand how they interact.
Smart Money and Forex Trading Sessions
Forex trades around the clock during the trading week, but liquidity and volatility vary throughout the day.
Three major periods are especially important:
- Asian session
- London session
- New York session
London and New York are particularly active for many major currency pairs.
Smart money traders often track session highs and lows because they can become short-term liquidity references.
For example, suppose EUR/USD creates a narrow range during the Asian session.
The Asian high is 1.0875.
The Asian low is 1.0845.
When London opens, price initially rallies above 1.0875 before sharply reversing downward.
A trader may interpret the move above the Asian high as a liquidity event.
But session-based strategies should never assume that price must reverse after taking a session high or low.
Sometimes London breaks the Asian high and simply continues higher for the rest of the session.
Again, confirmation matters.
Economic News Can Change Everything
Smart money analysis does not eliminate fundamental risk.
Forex prices can move aggressively around economic announcements such as:
- Central bank interest-rate decisions
- Inflation reports
- Employment data
- GDP releases
- Purchasing Managers’ Index data
- Central bank speeches
- Unexpected geopolitical developments
A beautiful technical setup can fail within seconds when major news changes market expectations.
For example, EUR/USD might appear positioned for a bearish liquidity setup shortly before a major central bank announcement.
If the announcement dramatically shifts interest-rate expectations, the market may produce enormous bullish displacement and invalidate the technical idea immediately.
This is why experienced traders normally know when major economic events are scheduled.
Technical structure explains what price is doing.
Macroeconomic information can help explain why capital is being repriced.
The two should not necessarily be viewed as competing approaches.
Common Mistakes Beginners Make With Smart Money
Smart money trading looks deceptively simple after watching annotated charts.
Live markets are much harder.
Several mistakes appear repeatedly.
Marking Too Many Order Blocks
If almost every candle becomes an order block, the concept loses usefulness.
Focus on zones connected to meaningful displacement and structure.
Treating Every High and Low as Liquidity
Technically, orders can exist around many levels.
But not every swing is equally significant.
Prioritize obvious levels that many market participants can see.
Entering Immediately After a Liquidity Sweep
A sweep does not guarantee reversal.
Wait for evidence that the market has actually reacted.
Ignoring Higher-Timeframe Structure
A perfect-looking one-minute bullish setup can fail easily when the daily and four-hour markets are aggressively bearish.
Moving Stop Losses Randomly
Your invalidation level should have a logical structural reason.
Moving a stop simply because price approaches it destroys the original risk calculation.
Risking Too Much
No smart money setup is guaranteed.
Even highly selective strategies experience losing trades.
A Practical Smart Money Analysis Checklist
Before entering a forex position, a trader can use a simple structured process:
- Determine the higher-timeframe market structure.
- Identify important swing highs and lows.
- Mark obvious buy-side and sell-side liquidity.
- Define the relevant dealing range.
- Determine whether price is in premium or discount.
- Wait for price to reach a meaningful location.
- Observe whether liquidity is swept.
- Look for displacement.
- Confirm a meaningful structural shift when required.
- Identify a logical entry area such as an FVG or validated order block.
- Define invalidation before entering.
- Identify realistic liquidity-based targets.
- Calculate position size based on predefined risk.
- Check the economic calendar.
- Execute only if the setup satisfies your trading plan.
This process helps turn smart money from a collection of chart terms into a repeatable analytical framework.
Risk Management Still Determines Survival
A sophisticated entry model cannot compensate for poor risk management.
Suppose a trader develops a strategy that produces profitable outcomes 55% of the time.
That can potentially be useful.
But if the trader risks 20% of the account on each position, a short losing streak can cause catastrophic damage.
Professional trading focuses heavily on survival.
A trader should know before entering:
Entry price
Stop-loss level
Position size
Amount at risk
Potential target
Risk-to-reward ratio
Suppose a forex trader has a $10,000 account and chooses to risk 1% on a setup.
Maximum planned loss:
$10,000 × 1% = $100
The position size should then be calculated so that reaching the predefined stop results in approximately that planned loss, subject to slippage, spreads, commissions, and execution conditions.
The principle is simple:
Determine risk first. Position size second.
Not the other way around.
Smart Money Is a Framework, Not a Shortcut
Perhaps the biggest mistake traders make is searching for the “secret” smart money strategy.
There is no single institutional pattern that guarantees profitable trades.
Banks lose trades.
Hedge funds experience drawdowns.
Professional traders make incorrect forecasts.
Algorithms can respond differently to changing market conditions.
Markets are probabilistic.
Smart money concepts become more useful when viewed as tools for organizing information:
Market structure tells you about direction.
Liquidity tells you where orders may be concentrated.
Displacement tells you when aggressive repricing may be occurring.
Fair value gaps identify areas created during rapid expansion.
Order blocks attempt to identify important origins of directional movement.
Premium and discount provide location within a range.
Risk management determines how much damage an incorrect idea can cause.
The real advantage is not finding one magical pattern.
It is learning to combine context, location, confirmation, execution, and risk into a consistent decision-making process.
Understanding the basic principles of smart money is only the beginning. Market structure, liquidity, fair value gaps, displacement, and order blocks become genuinely useful when they are combined into a repeatable trading process.
This is where many forex traders struggle.
It is relatively easy to open a historical chart and identify a perfect liquidity sweep followed by a market structure shift. It is much harder to recognize the same conditions while price is moving in real time, especially when several possible order blocks, liquidity pools, and fair value gaps exist simultaneously.
The solution is not to add more terminology. It is to develop a hierarchy.
A practical smart money approach should answer several questions in order:
- What is the broader market context?
- Where is price likely to encounter meaningful liquidity?
- Has price reached an important area?
- What happened after liquidity was taken?
- Has price demonstrated genuine displacement?
- Has short-term structure changed?
- Is there a logical location for entry?
- Where is the trade idea invalidated?
- Where could profits reasonably be taken?
This section explores these questions in greater depth and turns smart money concepts into a more structured forex trading framework.
How to Build a Smart Money Forex Strategy
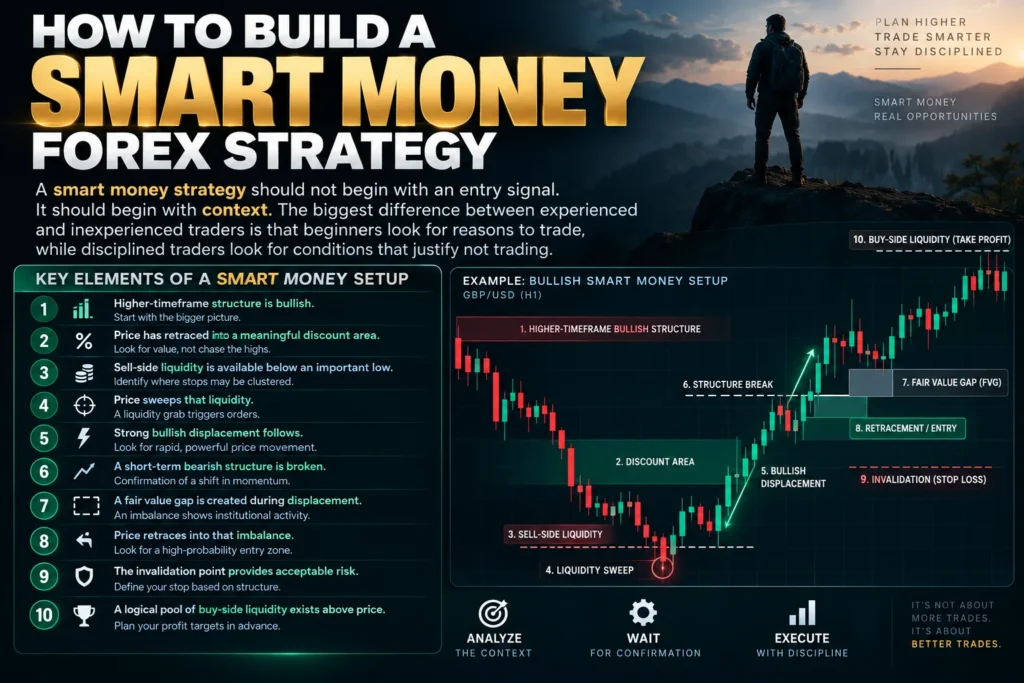
A smart money strategy should not begin with an entry signal.
It should begin with context.
One of the biggest differences between experienced and inexperienced traders is that beginners frequently search the chart for reasons to trade, while disciplined traders search for conditions that justify not trading.
A high-quality setup may require several factors to align.
For example:
- Higher-timeframe structure is bullish.
- Price has retraced into a meaningful discount area.
- Sell-side liquidity is available below an important low.
- Price sweeps that liquidity.
- Strong bullish displacement follows.
- A short-term bearish structure is broken.
- A fair value gap is created during displacement.
- Price retraces into that imbalance.
- The invalidation point provides acceptable risk.
- A logical pool of buy-side liquidity exists above price.
No single component guarantees success.
The value comes from confluence.
Step 1: Establish the Higher-Timeframe Bias
Before analyzing a five-minute or fifteen-minute forex chart, start with a larger timeframe.
Depending on your trading style, this could be:
- Weekly
- Daily
- 4-hour
- 1-hour
A swing trader may analyze weekly and daily charts.
An intraday trader might use daily and four-hour charts for context before moving to the 15-minute and 5-minute charts.
The objective is not necessarily to predict exactly where price will close.
Instead, determine the broader environment.
Ask:
- Is price producing higher highs and higher lows?
- Is it producing lower highs and lower lows?
- Is the market consolidating?
- Has important liquidity recently been taken?
- Is price near a major historical high or low?
- Is price trading in premium or discount relative to a meaningful range?
Suppose EUR/USD is structurally bullish on the daily chart.
Price recently moved from 1.0700 to 1.1100 and is now retracing.
Rather than automatically assuming the retracement means a new bearish trend has begun, a smart money trader might initially treat the decline as a potential correction within the broader bullish structure.
That creates a working hypothesis:
Look for evidence supporting long positions from strategically important lower prices.
Notice the wording.
It is a hypothesis, not a prediction.
If the market invalidates the bullish structure, the hypothesis must change.
Step 2: Map Important Liquidity
Once the broader structure is understood, identify locations where orders are likely to accumulate.
These may include:
- Previous day high
- Previous day low
- Previous week high
- Previous week low
- Equal highs
- Equal lows
- Major swing highs
- Major swing lows
- Session highs and lows
- Range boundaries
This creates a liquidity map.
Imagine EUR/USD is trading at 1.0920.
You identify:
Previous high: 1.1000
Equal highs: 1.0980
Current price: 1.0920
Equal lows: 1.0870
Major swing low: 1.0830
Instead of seeing a random chart, you now see potential destinations.
Buy-side liquidity may exist around 1.0980–1.1000.
Sell-side liquidity may exist around 1.0870 and 1.0830.
Your next question becomes:
Which liquidity pool is price more likely to interact with first, given the current structure and context?
That question is much more useful than asking whether RSI is currently at 47 or 53.
Understanding Inducement in Smart Money Trading
Inducement is a popular concept within smart money trading.
It generally refers to price behavior that encourages traders to enter positions before price moves toward another liquidity area.
For example, suppose EUR/USD is bullish.
Price retraces and forms an obvious support level.
Retail traders see the support and begin entering long positions.
Their stop losses accumulate underneath the level.
Price then moves below support, triggering those stops, before reversing upward.
Some smart money methodologies would describe the initial support as inducement.
The idea is that the obvious technical structure encouraged traders into positions whose stop orders later became available liquidity.
However, traders should be careful not to turn inducement into a storytelling exercise.
It is easy to look at any losing trade afterward and claim:
“That level was inducement.”
A more objective approach requires defining inducement before the trade.
For example:
I will consider a minor internal low potential inducement only when it forms ahead of a predefined higher-timeframe demand area and remains above a more significant liquidity pool.
Rules like this can actually be tested.
Without clear definitions, almost any price movement can be explained retrospectively.
Internal vs External Liquidity
Another useful distinction is between internal liquidity and external liquidity.
External Liquidity
External liquidity generally exists outside the boundaries of a significant trading range.
Examples include:
- Major swing high
- Major swing low
- Range high
- Range low
Suppose EUR/USD trades between:
1.0800 and 1.1000
Liquidity above 1.1000 and below 1.0800 can be considered external to the range.
Internal Liquidity
Internal liquidity exists inside the broader range.
This might include:
- Minor swing highs
- Minor swing lows
- Short-term equal highs
- Short-term equal lows
- Internal structural levels
Understanding the difference helps traders avoid treating every liquidity point as equally important.
A small five-minute high inside a daily trading range usually does not carry the same significance as a major daily swing high.
What Is Liquidity Engineering?
The phrase liquidity engineering is commonly used in smart money trading communities to describe price behavior that appears to create obvious technical structures before those levels are subsequently violated.
For instance:
- Price forms a clear support level.
- Traders begin buying support.
- More traders recognize the level after repeated reactions.
- Stops accumulate below it.
- Price eventually trades below the support.
- A strong reversal occurs.
From a chart-analysis perspective, this can look as though liquidity was deliberately “engineered.”
But caution is necessary.
A chart alone usually cannot prove that a specific institution intentionally created a pattern to trap retail traders.
The more useful takeaway is simply:
Obvious technical levels can attract orders, and areas containing many orders can become important liquidity zones.
You do not need a conspiracy theory to use the concept effectively.
Smart Money Order Blocks in Greater Detail
Order blocks are among the most misunderstood elements of smart money trading.
Beginners often mark every final bearish candle before an upward move as a bullish order block.
That produces dozens of zones.
A more selective process is needed.
Characteristics of a Stronger Bullish Order Block
A bullish order block may deserve greater attention when:
- It occurs near meaningful sell-side liquidity.
- Liquidity was swept before the bullish move.
- Strong bullish displacement originated from the area.
- The displacement broke meaningful structure.
- A fair value gap was created.
- The area aligns with higher-timeframe bullish context.
- Price has not repeatedly traded through the zone.
Characteristics of a Stronger Bearish Order Block
A bearish order block may be more relevant when:
- Buy-side liquidity has been taken.
- Strong bearish displacement follows.
- Important bullish structure is broken.
- The move creates an imbalance.
- The zone is located in a higher-timeframe premium area.
- The level remains relatively fresh.
The important principle is:
The candle itself is less important than what happened because price moved away from that area.
What Is Mitigation?
Mitigation generally describes price returning to a previously significant zone after a strong move.
Suppose EUR/USD produces bullish displacement from an order block.
Price rallies 80 pips and later retraces toward the original area.
Smart money traders may describe this return as mitigation of the bullish order block.
The expectation is not necessarily that price must touch the exact open, close, or midpoint of a particular candle.
Different methodologies define mitigation differently.
Some traders use:
- Entire candle range
- Candle body
- 50% level
- Opening price
- Fair value gap overlapping the order block
This is why backtesting matters.
If your trading model uses the midpoint of an order block, define that rule consistently rather than changing the definition after seeing what price did.
Order Block and Fair Value Gap Confluence
One useful form of confluence occurs when an order block overlaps a fair value gap.
Suppose GBP/USD sweeps sell-side liquidity and then generates strong bullish displacement.
The move leaves:
Bullish order block: 1.2530–1.2550
and:
Bullish FVG: 1.2540–1.2560
The overlapping area is:
1.2540–1.2550
Instead of treating both zones independently, a trader may focus on the overlapping price range.
This can provide a more precise area for monitoring a retracement.
However, precision should not create false confidence.
A narrower zone does not automatically mean a higher probability trade.
The overall context still determines whether the setup is worth considering.
Smart Money Entry Model: Liquidity Sweep to Market Structure Shift
One of the most practical smart money entry models combines several concepts in sequence.
Bullish Example
Assume EUR/USD is bullish on the four-hour chart.
Price retraces toward a significant low.
The trader waits for:
- Price to reach a predefined higher-timeframe area.
- Sell-side liquidity below a recent low to be taken.
- Bullish displacement to appear.
- A meaningful short-term high to break.
- A bullish FVG or order block to form.
- Price to retrace into the entry zone.
- A valid risk-to-reward opportunity to remain.
The sequence can be represented as:
Context → Liquidity → Reaction → Displacement → Structure → Retracement → Entry
That sequence is much more robust than:
FVG appears → Buy
Bearish Example
The opposite model would be:
Bearish context → Buy-side liquidity sweep → Bearish displacement → Bearish structure shift → Retracement → Short entry
This process helps prevent traders from entering simply because a familiar shape appears on the chart.
Detailed Forex Example: EUR/USD Smart Money Setup
Imagine EUR/USD is trading within a broader bullish daily structure.
The daily chart shows:
Major swing low: 1.0720
Major swing high: 1.1120
The midpoint of this range is approximately:
1.0920
Price begins retracing from 1.1120.
Eventually, EUR/USD trades below 1.0920 into the discount portion of the range.
A significant four-hour low exists at:
1.0860
Several previous lows have also formed around:
1.0860–1.0870
This makes the area interesting from a liquidity perspective.
Price falls to:
1.0845
Sell-side liquidity below the lows is taken.
Now the trader does nothing.
This is important.
The liquidity sweep alone is not enough.
EUR/USD then rallies aggressively from 1.0845 toward 1.0910.
During the rally:
- A 15-minute bearish swing high at 1.0890 is broken.
- Strong bullish displacement appears.
- A bullish FVG forms between 1.0870 and 1.0880.
- The move originates from a potential bullish order block near 1.0850.
The trader now has multiple forms of confirmation.
Price later retraces to approximately:
1.0875
This brings price back into the fair value gap.
A hypothetical plan might be:
Entry: 1.0875
Stop: 1.0835
Risk: 40 pips
Initial target: 1.0955
Potential reward: 80 pips
This creates approximately:
1:2 risk-to-reward
A secondary target might exist near previous buy-side liquidity around 1.1000.
The trade can still lose.
That fact should never be forgotten.
The purpose of the model is not to guarantee the outcome. It is to define a logical reason for entering, exiting, and accepting that the idea is wrong if the invalidation point is reached.
Where Should a Stop Loss Go?
Stop-loss placement is one of the most important parts of a smart money strategy.
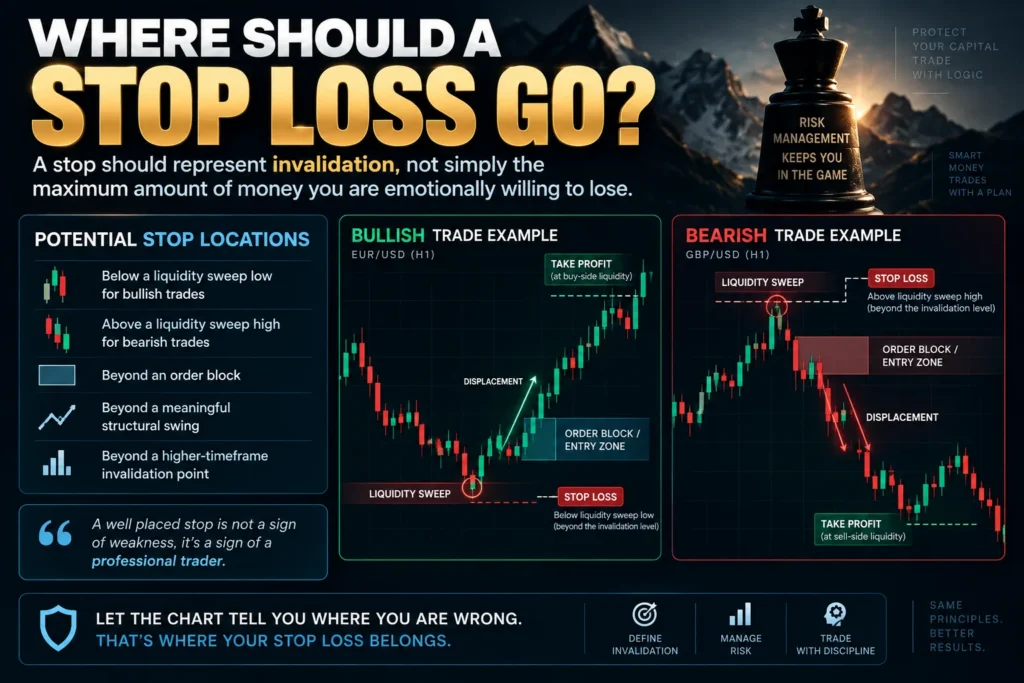
A stop should represent invalidation, not simply the maximum amount of money you are emotionally willing to lose.
For example, if your bullish thesis depends on a liquidity sweep low remaining intact, placing the stop above that low may not make structural sense.
Potential stop locations include:
- Below a liquidity sweep low for bullish trades
- Above a liquidity sweep high for bearish trades
- Beyond an order block
- Beyond a meaningful structural swing
- Beyond a higher-timeframe invalidation point
However, wider stops require smaller position sizes if account risk remains constant.
Suppose you are willing to risk $100.
If your stop is 20 pips away, your position size must be calculated so 20 pips represents approximately $100 of risk.
If the stop needs to be 50 pips away, the position size must be smaller.
Do not widen the stop and keep the same position size unless you intentionally want to increase monetary risk.
Smart Money Take-Profit Strategies
Smart money traders often use liquidity to identify potential targets.
Instead of choosing an arbitrary number of pips, they may target areas where price has a structural reason to travel.
Potential targets include:
- Previous swing highs
- Previous swing lows
- Equal highs
- Equal lows
- Previous day high or low
- Previous week high or low
- Opposing liquidity
- Higher-timeframe order blocks
- Range boundaries
Suppose a bullish position is entered after sell-side liquidity is swept.
Above price are equal highs.
Those highs may provide a logical profit objective.
A trader could also use partial exits.
For example:
- Close 30% at 1R.
- Close another 30% at 2R.
- Allow the remaining 40% to target external liquidity.
There is no universally correct exit strategy.
What matters is that the method can be defined, tested, and consistently executed.
Risk-to-Reward Ratio vs Win Rate
Traders sometimes obsess over having an extremely high win rate.
But profitability depends on the relationship between:
Win rate
and
average reward relative to average risk.
Consider Strategy A:
- Win rate: 40%
- Average winner: 3R
- Average loser: 1R
Across 100 hypothetical trades:
40 wins × 3R = +120R
60 losses × 1R = −60R
The theoretical result before costs is:
+60R
Now consider Strategy B:
- Win rate: 70%
- Average winner: 0.5R
- Average loser: 1R
Across 100 trades:
70 × 0.5R = +35R
30 × 1R = −30R
The theoretical result before costs is only:
+5R
This simplified example demonstrates why win rate alone tells you very little about a trading strategy.
Trading costs, slippage, execution quality, changing market conditions, and sample size also matter.
Position Sizing: The Professional Approach
Assume a forex trader has:
Account balance: $20,000
Maximum risk per trade:
0.5%
Maximum monetary risk:
$100
The trader identifies a smart money setup requiring a 25-pip stop.
Position size should be calculated based on the pip value of the specific currency pair and account denomination so that the planned stop represents approximately $100.
This means risk remains controlled regardless of whether the setup looks “perfect.”
That last point is crucial.
A trader should not suddenly risk 5% because five smart money concepts happen to align.
No setup is certain.
Multi-Timeframe Smart Money Analysis
One of the most effective ways to organize smart money analysis is to assign different jobs to different timeframes.
For an intraday trader:
Daily Chart
Use it to identify:
- Major trend
- Major swing points
- Important liquidity
- Broad premium/discount conditions
4-Hour Chart
Use it to identify:
- Intermediate structure
- Higher-timeframe order blocks
- Major fair value gaps
- Potential areas of interest
1-Hour Chart
Use it to refine:
- Session structure
- Internal liquidity
- More precise areas of interest
15-Minute or 5-Minute Chart
Use it for:
- Liquidity sweep confirmation
- Market structure shift
- Displacement
- Entry refinement
The lower timeframe should ideally help execute an idea generated from higher-timeframe context.
It should not constantly override the larger picture.
Smart Money Trading During London and New York
Timing can improve the quality of forex analysis.
EUR/USD and GBP/USD often experience increased activity during London and New York trading hours.
Rather than watching charts continuously, an intraday trader may define specific windows for analysis.
For example:
- Observe the Asian range.
- Identify the Asian high and low.
- Monitor London for liquidity interaction.
- Reassess before major scheduled news.
- Monitor New York for continuation or reversal.
This creates structure in the trading routine.
It also reduces the temptation to manufacture setups during low-activity periods.
However, no session pattern should be treated as guaranteed.
The London session does not always sweep Asia.
New York does not always reverse London.
Market behavior changes from day to day.
Smart Money and Fundamental Analysis
Smart money concepts are primarily based on price behavior, but forex is deeply influenced by macroeconomic conditions.
Currency valuation can respond to:
- Interest rates
- Inflation expectations
- Monetary policy
- Employment conditions
- Economic growth
- Bond yields
- Risk sentiment
- Capital flows
- Geopolitical events
Suppose technical analysis suggests USD/JPY is approaching buy-side liquidity.
At the same time, a major central bank decision is scheduled.
The trader should recognize that volatility could expand dramatically.
A liquidity level may still matter, but execution conditions can become significantly different.
Spreads may widen.
Slippage may increase.
Price can move through several technical zones almost instantly.
Smart money analysis should therefore exist within a broader risk-management framework rather than ignoring fundamental events.
Backtesting a Smart Money Strategy
Before risking real money, traders should test their rules on historical data.
But simply scrolling backward through a chart and finding perfect examples is not enough.
That creates hindsight bias.
A better process is to define the setup first.
For example:
Market: EUR/USD
Bias timeframe: 4H
Execution timeframe: 15M
Required event: Sweep of external liquidity
Confirmation: Displacement + structure shift
Entry: First retracement into FVG
Stop: Beyond sweep extreme
Target: Opposing liquidity
Maximum risk: 0.5%
Now collect a meaningful sample.
Record:
- Date
- Currency pair
- Session
- Higher-timeframe bias
- Entry
- Stop
- Target
- Risk-to-reward
- Outcome in R
- Maximum adverse excursion
- Maximum favorable excursion
- News conditions
- Screenshot
- Notes
After dozens or preferably hundreds of examples, patterns may emerge.
Perhaps the strategy performs better during London.
Maybe EUR/USD produces better results than GBP/JPY.
Perhaps setups immediately before major economic announcements perform poorly.
This is where trading becomes evidence-based rather than narrative-based.
Forward Testing Matters Too
Historical testing has limitations.
You already know what happened next, even when trying not to look ahead.
Forward testing removes some of that advantage.
A trader can use a demo account or simulated environment to execute the strategy in real time.
This tests factors that historical chart review cannot fully reproduce:
- Decision pressure
- Missed entries
- Spread changes
- Slippage
- Hesitation
- Overtrading
- Emotional responses
- Real-time ambiguity
A strategy that looks easy on historical charts can feel completely different when the next candle is unknown.
Keep a Smart Money Trading Journal
A trading journal is one of the most valuable tools available to serious traders.
For every position, record why the trade was taken.
A useful journal might include:
Market: EUR/USD
Direction: Long
Higher-timeframe bias: Bullish
Liquidity event: Previous day low swept
Confirmation: Bullish MSS
Entry model: FVG retracement
Risk: 0.5%
Target: Previous day high
Result: +2.1R
Then add a screenshot before and after the trade.
Over time, this creates your own database.
That database can answer questions such as:
- Which setup produces the best expectancy?
- Which session performs best?
- Which currency pairs suit the strategy?
- Are you losing because of the model or execution?
- Do you frequently exit winners too early?
- Are most losses occurring around news?
- Are you taking trades outside your written rules?
That information is far more valuable than constantly switching between strategies.
Common Smart Money Myths
Smart money trading has become extremely popular, and popularity naturally creates misconceptions.
Myth: Banks Always Hunt Retail Stop Losses
Large institutions certainly care about liquidity.
But claiming that every forex movement exists specifically to hunt retail stops is unrealistic.
Forex contains many participants with different objectives.
A stop sweep is observable.
The exact intention behind every market move usually is not.
Myth: Every Fair Value Gap Must Be Filled
No.
Some gaps are revisited quickly.
Some are revisited much later.
Others may never be completely filled within the timeframe relevant to your strategy.
Myth: Every Order Block Causes a Reversal
Order blocks fail frequently.
Context, structure, liquidity, volatility, and timing all matter.
Myth: Smart Money Concepts Predict the Market
They provide an analytical framework.
They do not provide certainty.
Myth: More Confluence Means Guaranteed Trades
Five signals can fail simultaneously.
Confluence can help define a setup, but risk management remains essential.
Myth: Smart Money Is Completely Different From Traditional Analysis
There is considerable overlap.
Swing highs and lows resemble classical market structure.
Liquidity zones often overlap with support and resistance.
False breakouts have existed as a trading concept for decades.
Smart money terminology often provides a different framework for interpreting familiar market behavior.
How Beginners Should Learn Smart Money Trading
Trying to learn every concept simultaneously is usually counterproductive.
A better learning sequence is:
- Learn basic candlestick behavior.
- Understand swing highs and lows.
- Learn bullish, bearish, and ranging structure.
- Study support, resistance, and liquidity.
- Understand buy-side and sell-side liquidity.
- Learn displacement.
- Study BOS and market structure shifts.
- Add fair value gaps.
- Add order blocks.
- Practice multi-timeframe analysis.
- Build one entry model.
- Backtest it.
- Forward test it.
- Review performance statistically.
Do not rush into advanced terminology before understanding basic price structure.
A trader who understands market structure deeply is usually better positioned than someone who can identify twenty different smart money patterns but cannot explain why a swing high matters.
Creating a Simple Smart Money Trading Plan
A practical trading plan should fit on one page.
For example:
Markets: EUR/USD and GBP/USD
Trading session: London
Higher-timeframe analysis: 4H
Execution: 15M and 5M
Setup requirements:
- Price reaches higher-timeframe area of interest.
- Relevant liquidity is swept.
- Displacement occurs.
- Market structure shifts.
- FVG or order block provides retracement opportunity.
Risk: Maximum 0.5% per trade
Minimum risk-to-reward: 1:2
Maximum trades per day: 2
News rule: No new positions immediately around predefined high-impact announcements.
Invalidation: Structural level defined before entry.
The purpose of rules is not to eliminate losses.
Rules make results measurable.
Without consistency, you cannot determine whether a strategy actually works.
When You Should Not Trade
Knowing when not to trade can be more important than finding entries.
Consider avoiding a setup when:
- Higher-timeframe structure is unclear.
- Price is trapped in random consolidation.
- No meaningful liquidity event has occurred.
- Risk-to-reward is poor.
- The required stop is unreasonably large.
- Major news is imminent and your plan excludes news trading.
- You have already reached your daily loss limit.
- You are entering because of fear of missing out.
- The setup does not satisfy your written rules.
“No trade” is a valid trading decision.
Capital that is not unnecessarily exposed remains available for another opportunity.

Smart Money Trading Example: From Analysis to Execution
Consider another hypothetical forex scenario.
GBP/USD is bearish on the four-hour chart.
Price has been producing:
Lower High → Lower Low → Lower High → Lower Low
Price then retraces upward.
Above the market sits a previous day high at:
1.2780
A four-hour bearish order block exists around:
1.2780–1.2810
Price rallies to:
1.2795
The previous day high is taken.
Now the trader moves to the 5-minute chart.
Price initially continues higher but then produces aggressive bearish displacement.
A recent 5-minute swing low at 1.2770 breaks.
A bearish fair value gap forms between:
1.2775–1.2785
Price retraces to 1.2780.
The trader now has:
- Bearish higher-timeframe structure
- Higher-timeframe premium location
- Buy-side liquidity sweep
- Bearish displacement
- Lower-timeframe structural break
- Bearish FVG
- Logical invalidation above the sweep high
- Sell-side liquidity below price as a potential target
This is a complete trade thesis.
Compare it with:
“Price touched a bearish order block, so I sold.”
The first approach can be defined and tested.
The second relies heavily on a single pattern.