Why Do Forex Spreads Widen at Night?
Why Do Forex Spreads Widen at Night?
Forex spreads often widen at night because fewer competitive quotes are available during certain trading-session transitions, especially around the end of the New York trading day. When liquidity thins, the best available bid can fall, the best available ask can rise, or both can happen at once. That makes the gap between the two prices larger, even when the midpoint barely moves. The timing and size of the change depend on the currency pair, your broker’s pricing, and what else is happening in the market.
The word “night” can make this sound more predictable than it is. Midnight on your phone might coincide with the New York close, the start of a more active period in Asia, or an ordinary hour in the trading week. To understand a spread spike, start with the two prices your platform was quoting and the time zone attached to them. Those details can explain why a trade suddenly looked more expensive while the chart appeared almost unchanged.
What Are Forex Spreads and How Are They Measured?
The forex spread is the difference between the bid price, at which you can sell the base currency, and the ask price, at which you can buy it. In EUR/USD, the euro is the base currency and the U.S. dollar is the quote currency. A quote tells you how many dollars one euro costs. If the bid is 1.08496 and the ask is 1.08504, a buyer pays 1.08504 dollars per euro, while a seller receives 1.08496 dollars per euro, assuming execution at those quoted prices.
Calculate the spread in pips
Subtract the bid from the ask to get the spread in price units. To express it in pips, divide that difference by the pair’s pip size. For EUR/USD, one pip is 0.0001. The fifth decimal place on a five-decimal quote represents a tenth of a pip. On a pair such as USD/JPY, one pip is 0.01, so the third decimal place on a three-decimal quote represents a tenth of a pip. Check the platform’s units if it displays the spread in points, since reading eight fractional points as eight full pips can make a normal quote look ten times wider.
- Earlier EUR/USD quote: A bid of 1.08496 and an ask of 1.08504 produce a spread of 0.00008, or 0.8 pips.
- Later EUR/USD quote: A bid of 1.08480 and an ask of 1.08520 produce a spread of 0.00040, or 4.0 pips.
- Midpoint of both quotes: The average of the bid and ask is 1.08500 in each case.
These are hypothetical prices, chosen to show what spread widening looks like when the midpoint stays fixed. A trader looking to buy would see the available ask move from 1.08504 to 1.08520. A trader looking to sell would see the bid move from 1.08496 to 1.08480. The market offers less favorable prices on both sides, even though a chart based on the midpoint would show no change between those two snapshots.
Translate a wider quote into a trading cost
Suppose you buy 10,000 euros in EUR/USD at the ask and immediately sell them at the bid, with both quotes unchanged during the round trip. At the 0.8-pip spread in the example, the difference is $0.80. At the 4.0-pip spread, it is $4.00. You can reproduce the calculation by multiplying the price difference by 10,000 euros. The result is in dollars because USD is the quote currency. If your account uses another currency, the platform may convert the amount when reporting it.
This calculation isolates the spread by assuming an immediate round trip at the displayed prices. A real trade can have a different spread at entry and exit, and market prices can move while the position is open. A commission can also apply to either or both sides, depending on the account. If the fill differs from the expected price, that difference is slippage. Separating these components makes it easier to understand why a trading statement shows a cost that differs from the spread you remember seeing on screen.
Why Lower Liquidity Makes Forex Spreads Wider
Fewer competitive quotes can push the bid and ask apart
Liquidity describes how easily you can trade a given amount without significantly changing the price. In a liquid market, several participants may be willing to buy or sell at prices close to one another. When one participant withdraws a quote, another may still be offering a similar price. In thinner conditions, the next available price can be farther away. A broker that draws on external pricing can then receive a less competitive bid, a less competitive ask, or a wider gap on both sides. The final retail quote also depends on how the broker constructs its prices.
Imagine that three providers are quoting a currency pair and that one offers the highest bid. If that provider withdraws its quote, the next highest bid becomes the best available sell price in that group. The lowest ask may stay exactly where it was. The spread has now widened from the bid side alone. This matters when diagnosing a chart that seems to show a small downward move. If the chart displays bid prices, it may reflect a deterioration in the price at which traders can sell while leaving the buy price out of view.
Quote size and quote width describe different things
The spread tells you how far apart the displayed prices are. Market depth tells you how much can be traded at those prices and at nearby levels. Imagine seeing the same 1.0-pip spread on two occasions. On the first, several providers may be willing to trade at or near the displayed quote. On the second, the available amount near the quote may be much smaller. The number on the screen looks identical, but a larger order could encounter different execution conditions. The spread is one observable measure of liquidity, and it gives you only part of the picture.
The reverse is also worth understanding. A wide spread can appear during a quiet stretch with little visible price movement. Providers may still quote cautiously because fewer counterparties are available and a quote could become stale before they can adjust it. A chart measures how prices move over time, while the spread measures the distance between two prices at a given moment. A flat chart and a wide spread can therefore coexist.
Currency pairs can behave differently in the same minute
Liquidity depends on the pair. A major pair such as EUR/USD can have a different spread pattern from a less actively traded cross or a pair with more restrictive trading hours. Even among frequently traded pairs, the mix of participants changes across the day. For instance, a trader comparing EUR/USD with USD/JPY during Asian hours is looking at two different markets with different sources of order flow. A useful comparison starts with each pair’s own spread history at the same time of day.
Consider a hypothetical EUR/USD spread of 2.5 pips and a USD/JPY spread of 2.5 pips. The numbers match, but their cash impact can differ for the same base-currency position size. EUR/USD expresses its price in dollars, while USD/JPY expresses its price in yen. Converting both costs into your account currency gives you a common unit. Comparing each quote with its usual range for that session answers a separate question about whether the spread was unusually wide for that pair.
How the New York Close and Daily Rollover Affect Forex Spreads
The forex trading week has a daily handover
Retail forex is commonly described as a market that runs around the clock during the trading week. Regional trading activity shifts as business hours end in one financial center and begin in another. Around the end of the New York trading day, the flow of orders and quotes can change, and retail platforms can have their own daily breaks. As a concrete example, OANDA’s U.S. trading-hours page lists a daily break from 4:59 p.m. to 5:05 p.m. New York time for its forex instruments. That schedule illustrates how a platform’s trading availability can change briefly even on a weekday.
For traders investigating an overnight spread spike, around 5 p.m. New York time is a useful reference. The exact minute your broker pauses an instrument, resumes quoting, or applies its financing rules comes from the applicable account and symbol specifications. Spread widening can develop before a break or appear when quotes resume. Looking at a window around the transition can reveal a pattern that a single screenshot at precisely 5 p.m. would miss.
Rollover financing and spread widening affect different numbers
In retail forex, “rollover” often refers to the daily cutoff used to determine whether an open position is subject to overnight financing. Depending on the product, position direction, and broker terms, financing can be a debit or a credit. The spread is visible in the bid and ask quote. The financing adjustment is applied according to the broker’s rules and may appear as a separate entry or field in the account history. OANDA, for example, documents its financing calculation and uses the New York day close as a reference.
Suppose you hold a long EUR/USD position through the cutoff. If the bid falls as the spread widens, the position’s unrealized profit or loss can change because the available sell price has changed. If the account also applies a financing debit, you may see that charge in the account history. The first change comes from the live exit quote. The second comes from the financing terms. Reviewing the quote history alongside the statement helps you identify how much each contributed.
Convert the timestamp before calling a spike “overnight”
A platform timestamp can follow broker server time, while your phone follows local time and a market calendar uses New York time. Even if you trade from the same desk every day, the local hour corresponding to the New York close can shift when U.S. daylight saving time changes, depending on the time zone where you live. That can make a recurring event appear to have moved by an hour. Record the date and time zone alongside the hour so you can make the right comparison.
- Record the currency pair, the date, and the timestamp shown by your trading platform.
- Identify the time zone used by the quote or order history, including any daylight saving adjustment in effect on that date.
- Convert the timestamp to New York time and compare it with the broker’s published trading hours for that symbol.
- Compare synchronized bid and ask quotes from before, during, and after the event if your platform makes them available.
When examining quotes from the Qmmfx broker, use the specifications for the actual account type and instrument you are reviewing. Record any commission separately, check how the platform labels points and pips, and use contemporaneous quotes when you have them. An advertised starting spread describes the low end of a pricing offer. A timestamped bid and ask show what was displayed at the moment you are investigating.
How to Tell a Routine Spread Spike From a Different Market Event
Look for a pattern across comparable trading days
If the spread expands around the same New York time on several ordinary weekdays and then returns to its previous range, the timing is consistent with a daily liquidity transition or broker session break. Compare the same pair on the same account type and use the same sampling method each day. A snapshot taken once per minute can miss a spike that appears and disappears between observations. A tick-by-tick record, when available, gives you a clearer view of how wide the quote became and how long it stayed there.
The duration matters alongside the size. A brief jump from 0.8 to 4.0 pips and a sustained period of 4.0-pip quotes have the same peak. The longer episode creates more chances for an order to interact with the wider prices. For a useful comparison, note the spread just before the event, the widest observed quote, and the approximate time it took for the spread to return to its prior range. If your record is incomplete, describe the peak as the widest quote you observed.
Check whether both prices moved in the same direction
Suppose EUR/USD starts with a bid of 1.08496 and an ask of 1.08504. If both prices rise by 10 pips, to 1.08596 and 1.08604, the midpoint rises by 10 pips while the spread remains 0.8 pips. In the earlier example, the spread increased to 4.0 pips while the midpoint stayed at 1.08500. Both events can look significant on a chart, and they describe different changes in the quote. During a fast market, a directional move and a spread expansion can occur together.
When both effects occur together, an economic calendar can help you check whether a scheduled data release or central bank announcement coincided with the change. A quiet period can produce wide spreads through reduced participation, while a busy news period can produce wide spreads because prices are changing quickly and providers are updating or withdrawing quotes. Time of day gives you a clue. The bid, the ask, and the timing of any identifiable event give you a better basis for interpreting it.
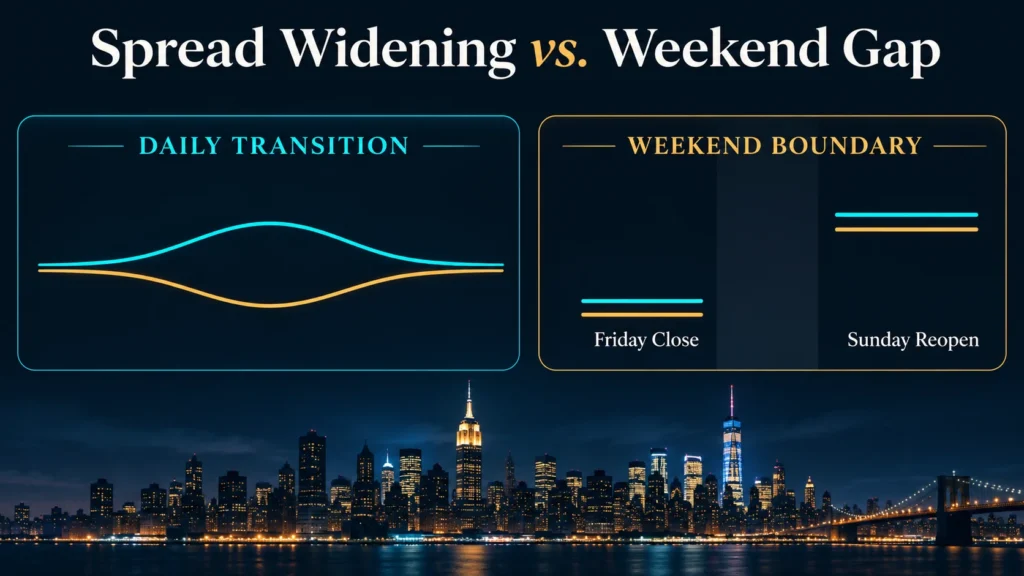
Compare the daily transition with the weekend boundary
Friday’s close and the Sunday reopening in New York add another consideration. A spread can widen while trading is still available, and the first quote after the weekend can also appear at a different price level from the final Friday quote. That second change is a price gap across the closure. To assess what happened, compare Friday’s final bid and ask with Sunday’s first available bid and ask. The difference between each quote’s two sides shows the spread, while the movement between their midpoints shows how far the quote shifted across the break.
For any spread spike, the most informative record starts with the last normal quote, the widest observed quote, and the first quote back in the earlier range. That sequence shows whether the bid fell, the ask rose, or both sides moved. It also gives you the prices you need to understand what happens to open trades and pending orders when only one side of the quote reaches an order level.
How Wider Forex Spreads Affect Open Positions and Stop-Loss Orders
Once you know which side of the quote moved, you can work out how the spread affected your trade. An open long position is closed by selling, so the bid is the relevant exit quote. An open short position is closed by buying back, so the ask is the relevant exit quote. When forex spreads widen, either side can reach an order level while the other side remains some distance away. The trigger rules for your specific order and platform determine what happens next.
How a lower bid can trigger a stop on a long position
Imagine you are long EUR/USD and your platform uses the bid to trigger a sell stop that closes the position. Your stop is at 1.08485. The last quote you saw was 1.08496 bid and 1.08504 ask, so the bid was 1.1 pips above the stop. During the overnight transition, the next quote is 1.08480 bid and 1.08520 ask. The bid is now 0.5 pips below the stop level. Under the assumed trigger rule, the order can activate even though the midpoint of both quotes is 1.08500.
The difference between the stop level and the bid in that second quote also illustrates why the trigger and the fill are two separate events. The stop specifies the level at which the order becomes eligible for execution. If the price moves across that level between quote updates, an ordinary stop can execute at the prevailing available price, which may differ from the stop level. To reconstruct the trade, you need the trigger level, the bid at or around the trigger, and the actual fill from your order history.
How a higher ask can trigger a stop on a short position
Now suppose you are short EUR/USD with a buy stop at 1.08515 and your platform uses the ask to trigger it. With the ask initially at 1.08504, the stop is 1.1 pips away. When the quote widens to 1.08480 bid and 1.08520 ask, the ask moves above your stop. A bid-based chart may show a drop at the same moment. From that chart alone, it can look as though the price moved in your favor. The ask shows that buying back the position had actually become more expensive.
This is a common source of confusion when reviewing a short trade. A screenshot showing the stop line above the candle high can accurately reflect the prices displayed in the chart. The short position’s closing order may still have been triggered by an ask that the chart omitted. If the platform can display the ask or export historical bid and ask ticks, compare the relevant quote with the broker’s trigger rule. A current ask line helps you monitor live quotes. Historical ask data is what you need to check a past event.
How take-profit orders can be affected by the same quote change
The spread can also affect whether a trade reaches its profit target. Suppose a long position has a take-profit at 1.08600, with a rule that uses the bid to determine whether the target is reached. A quote of 1.08588 bid and 1.08612 ask has a midpoint of 1.08600. On a midpoint chart, the price can appear to touch the target. The available sell quote is still 1.2 pips below it. A short position has the corresponding issue on the buy side when the ask remains above its target.
The practical detail is the distance from the order to the relevant side of the live quote. If your target is only a few pips away, a modest increase in spread can account for a meaningful share of that distance. For a trade with a much wider target, the same spread change represents a smaller share of the planned move. The impact still depends on when you need to transact. A brief spike that occurs while a position is open can matter if it reaches an active order or affects margin calculations.
What Wider Forex Spreads Mean for Pending Orders and Execution
Check which quote activates an entry order
A pending buy stop is often used to enter a long position when the market rises to a specified level. If the platform uses the ask as the trigger, the ask can reach that level during a spread spike while the bid and midpoint remain below it. For example, with a buy stop at 1.08515 and a quote of 1.08480 bid and 1.08520 ask, the ask has crossed the order level. The order can activate under that rule, even though a chart that shows the bid may give little visual evidence of an upward breakout.
The same logic applies to a sell stop on a platform that triggers it from the bid. If the best available bid drops during a spread expansion, it can reach the sell stop even while the ask stays firm or moves higher. For traders using pending orders to act on breakouts, the distinction is between the price used to identify the setup and the price used to activate the order. When the chart uses one and the order uses the other, the two signals can occur at different times.
A limit order works differently because it sets an acceptable price boundary. A buy limit specifies the highest price you are willing to pay, and a sell limit specifies the lowest price you are willing to accept. Execution depends on the broker’s order terms and whether the required price is available. If the side of the quote relevant to your limit moves away from the order as the spread expands, the order can remain pending even while a chart based on another price appears to touch the level.
Separate the spread you saw from the slippage you received
Suppose EUR/USD is quoted at 1.08480 bid and 1.08520 ask when you submit a market buy. The spread at that moment is 4.0 pips. The buy-side reference price is 1.08520. If your trade fills at 1.08527, the difference from that reference is 0.7 pips of adverse slippage. The spread describes the gap between the quoted buy and sell prices. The slippage describes the change between your chosen execution reference and your fill. Slippage can also be favorable if the fill improves on the reference price.
Some trading platforms display indicative quotes or update the screen less frequently than the pricing feed. If you compare a fill with a price you saw just before clicking, you are measuring the difference from your own reference. To check what happened during execution, compare the broker’s order acceptance timestamp and available quote data with the fill timestamp and price. If the records only show whole seconds, several price updates could have occurred within the same timestamp. That limits how precisely you can attribute the difference.
Distinguish a wide quote from a pause in trading
A wide spread still consists of a bid and an ask. During a scheduled trading pause, the instrument may be unavailable for new executions even if the platform continues to show the last prices. If an order was open during the pause, the first eligible quote after reopening can be farther away than the final quote before the pause. Whether the order can trigger during that transition and what happens if its level is crossed depend on the instrument schedule and order terms. Published trading hours help establish when the instrument was available.
When reviewing such an event, look for a gap in quote timestamps and check whether it lines up with the published break. If you have a continuous stream of ticks and the bid and ask move farther apart, you have evidence of spread widening. If the feed stops and resumes at a different level, you can measure the price change across the interruption as well as the spread when quoting resumes. Both effects can influence a single fill.
How to Estimate the Cost of an Overnight Spread Spike
Use the quote at each leg of the trade
For a long position, calculate gross trading profit or loss from the actual buy and sell fills. Subtract the entry fill from the exit fill and multiply by the number of base-currency units. For a short position, subtract the buyback fill from the initial sell fill and multiply by the position size. Account for commissions and any applicable financing separately. For pairs where your account currency differs from the quote currency, use the relevant conversion rate to translate the result.
To estimate the effect of spreads separately from market movement, compare your fills with the midpoints available at each leg. Suppose you buy 10,000 euros at 1.08504 when EUR/USD has a midpoint of 1.08500 and a spread of 0.8 pips. Later, you sell at 1.08530 when the midpoint is 1.08550 and the spread is 4.0 pips. Both fills occur at the relevant displayed quote. The midpoint rose by 5.0 pips, while the difference between the actual buy and sell prices was 2.6 pips. Before commissions and financing, the trade made $2.60.
In this example, the entry ask was 0.4 pips above the entry midpoint. The exit bid was 2.0 pips below the exit midpoint. Together, those differences account for the 2.4-pip gap between the midpoint move and the result from the fills. This comparison also gives you a way to model a different exit. If the midpoint had remained 1.08550 and the exit spread had been 0.8 pips, the bid would have been 1.08546. At that hypothetical price, the trade would have made 4.2 pips before other charges, or $4.20. The $1.60 difference isolates the effect of the wider exit spread under those assumptions.
Consider the spread relative to the size of the expected move
A fixed spread figure can mean very different things for different trading setups. If the expected midpoint move is 5 pips, paying 2.4 pips in combined entry and exit spread costs consumes 48% of that move in the example above. Against a 50-pip midpoint move, the same cost represents 4.8%. These percentages come from the hypothetical figures. Actual spreads, fills, and price moves vary by trade. The comparison helps explain why short-horizon strategies can be particularly sensitive to the timing of entries and exits.
Commission matters in this comparison as well. An account with a tighter displayed spread and a separate commission may have a higher or lower total cost than a spread-only account. Put the charges into a common unit before comparing them. If your position is worth $1 per pip and the total round-trip commission is $1.20, that commission adds 1.2 pips to your measured cost. Check whether the amount you are using applies per side or to the full round trip, and whether it scales with trade size.
Check the effect on equity and available margin
A spread spike can affect an open position before any order executes. When a platform values a long position using its available closing bid, a lower bid reduces the displayed unrealized profit or increases the unrealized loss. A higher ask can do the same to a short position valued using the buyback price. If equity falls far enough relative to the margin requirement, the account can reach a margin closeout threshold. The valuation method and closeout rules come from the broker’s terms.
For example, a fall of 1.6 pips in the bid changes the marked value of a 10,000-unit long EUR/USD position by $1.60, assuming the account is in dollars and uses the bid to value the position. At 100,000 units, the same change is $16. If several positions are affected during the same session transition, their changes can add up across the account. That makes account equity and position size relevant when assessing the practical impact of an apparently small change in a single quote.
How to Review a Trade Affected by Wider Forex Spreads
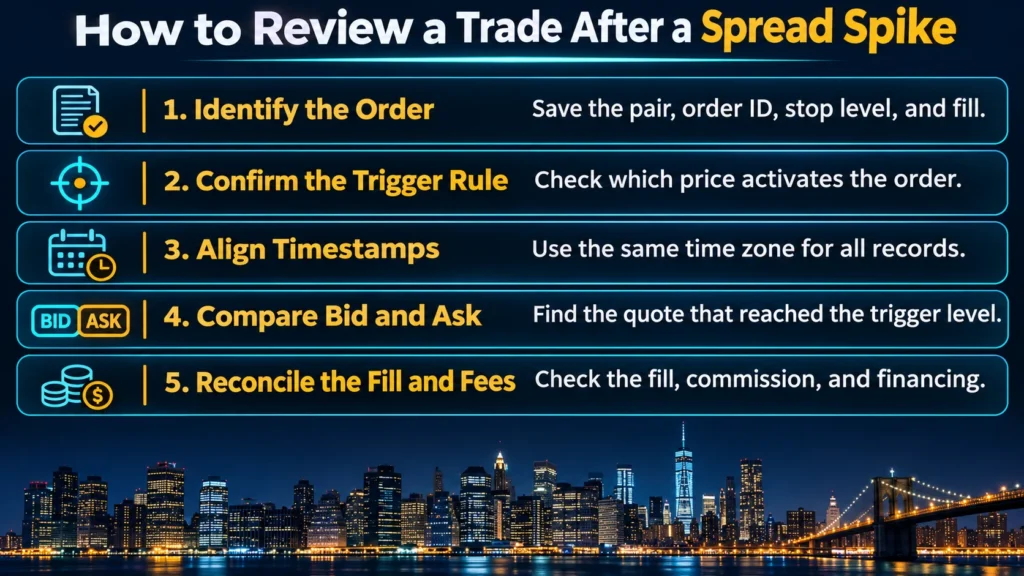
Start with the order or position history and write down exactly what happened. “My short stop triggered when the visible candle stayed below it” identifies the position direction, the order, and the discrepancy you want to check. From there, collect the prices and timestamps that correspond to that specific event.
- Identify the order. Record the symbol, position direction, order type, requested level, fill price, and position size. Save the ticket or order ID if one is available.
- Confirm the trigger rule. Check which price the broker uses to activate that order on your platform and account. Look for any conditions that apply around trading breaks.
- Align the timestamps. Bring the order history, chart, and quote data into the same time zone. Keep the original timestamps alongside your converted times if you need to share the records.
- Compare both sides of the quote. Find the available bid and ask immediately before and after the trigger. Check whether the price specified in the order rule reached or crossed the order level.
- Reconcile the execution and charges. Compare the fill with the available quote and check the statement for any commissions or financing entries that affected the final result.
If you are reviewing an order with the Qmmfx broker, the account type, instrument, server timestamp, and order ID give support a specific event to investigate. For a short stop, a precise question is which ask quote triggered the order, what time that quote was recorded, and what price the order subsequently filled at. If you are querying an unexpected charge, ask how the statement labels commission and overnight financing for that account. Keeping the execution question and the fee question distinct makes it easier to reconcile the response with your records.
A quote from another forex platform can provide context if you compare the same pair at the same instant and have both sides of the price. Different brokers can show different spreads and update at different times. The comparison may show whether other feeds widened around the same event. Your account’s quote and execution records are the evidence needed to assess whether its own trigger and fill matched the applicable order terms. Once you can reconstruct those events, the same records can help you judge when a spread is unusually wide for your pair and how much of your expected price move it could consume.
How to Manage Overnight Forex Spread Costs
Managing overnight forex spreads starts with knowing what a normal quote looks like for the currency pair, account, and time window you trade. A spread that seems expensive compared with the middle of the London session may be typical near your broker’s daily break. A spread that looks acceptable on its own may still be too expensive for a strategy with a small expected price move. Comparing the quote with both your historical observations and your strategy’s cost assumptions gives you a basis for deciding when to enter, exit, or wait.
Build a spread baseline for the hours you actually trade
Track the same pair on the same account across several comparable trading days. Include a period when you normally trade, the window around the New York close, and a period after quotes have resumed or stabilized. If your broker publishes different trading hours for the symbol, use those hours to define the observation windows. A regular schedule makes the results easier to compare and helps reveal whether the spread tends to widen at a particular point in the session transition.
Keep the log simple enough to maintain. A spreadsheet can capture what you need for a manual review. If your platform provides timestamped bid and ask data, use that history to measure short-lived changes that snapshots may miss. Use the same units throughout. A column marked “spread in pips” is especially helpful if the terminal reports the difference in fractional points.
- Identify the quote. Record the currency pair, broker account type, date, and timestamp with its time zone.
- Record both prices. Save the bid and ask from the same update, then calculate the difference in pips.
- Mark the trading window. Note whether the quote came from your usual trading session, the period around rollover, or the period after the broker resumed trading.
- Note unusual conditions. Tag observations near a scheduled economic release, holiday, or weekly reopening so they can be identified when you review the results.
- Record gaps in the data. Mark periods when the symbol was unavailable or your feed did not provide usable quotes. Leave those periods blank when calculating spread statistics.
Once you have a sample, calculate the median spread in each window. The median describes the middle observation and is less affected by an unusually large quote than the arithmetic mean. Also record the upper end of what you observed. With a reasonably sized sample, the 90th percentile can show the spread at or below which about 90% of your observations fell. If you have only a handful of snapshots, report the observed range and how many readings you took. That gives you a clearer sense of how much confidence to place in the figures.
Set an entry rule that reflects your strategy’s cost assumptions
If your strategy assumes a maximum entry spread, decide how you will apply that condition before the session begins. A manual trader can check the current bid and ask before submitting a new order. An automated strategy can test the spread before placing an order if the platform exposes the required quote data. For an order already resting with the broker, check whether any spread condition can be enforced at the time the order triggers. A check performed when you place an order describes the spread at placement, which may differ materially from the spread at execution.
For a hypothetical example, suppose a strategy targets an 8-pip favorable move in the midpoint and budgets up to 2 pips for entry and exit costs combined. A 3-pip entry spread already implies a cost of 1.5 pips relative to the entry midpoint if the order fills at the displayed quote. That leaves 0.5 pips of the budget for the exit spread, commission, and any adverse slippage. If the expected exit and commission together amount to 1.2 pips, the trade would exceed its budget by 0.7 pips. The figures illustrate how to derive a spread threshold from a strategy’s own assumptions.
Apply an entry filter and an exit plan according to their different purposes. An entry filter controls whether you take on new exposure. An exit may be needed to reduce exposure already on the account, even when the available quote is wide. If your plan depends on being able to exit during a scheduled break, check the instrument’s trading availability in advance. A spread threshold cannot make an unavailable symbol tradable.
Plan overnight exposure before the spread starts changing
If you regularly hold trades through rollover, look at the position size, order levels, and account margin together. A stop’s distance from a chart price gives only a partial picture when the chart and the order use different prices. Check the live quote on the side that matters to the order and ask how a spread expansion within your observed range could affect it. A move that looks small on a midpoint chart can materially reduce the distance to a trigger.
Suppose an overnight position has a stop 4 pips from the current exit quote. Your recent observations show that the relevant side of the quote has sometimes moved 2 pips farther from the midpoint during rollover. If the midpoint stays unchanged and that pattern recurs, the distance to the stop could shrink to about 2 pips. A simultaneous directional move could reduce it further. The example shows why it is useful to record which side of the quote usually changes in your own data. The total spread alone cannot tell you how much of the change will occur on the bid or ask.
If a trade plan calls for a different stop level, recalculate the potential cash loss at that level before making a change. Increasing the distance to a stop while keeping the same position size increases the planned loss if the stop fills at the specified price. An ordinary stop may also fill beyond that price when quotes move quickly or reopen across the level. Account for that possibility when evaluating how much exposure the account can carry through a session transition.
How to Compare Forex Brokers on Overnight Pricing
Compare live observations for the same pair and time window
A broker comparison works best when the observations answer the same question. If you want to know which account has lower trading costs around the New York close, compare the same currency pair on both accounts during that window. A quote captured in a busy session on one account and a rollover quote on another tell you little about how the accounts price the same conditions. Synchronize the timestamps as closely as possible and confirm that the products have comparable contract specifications.
Use the same sampling interval for both accounts. A feed checked once a minute can produce a lower observed peak than a feed recorded on every update simply because it has fewer chances to capture a brief spike. If one broker stops quoting during a scheduled break, record the interruption as a separate observation. A pricing comparison can then show how spreads behaved when both accounts were quoting, while the trading schedule tells you when each account was available for execution. Qmmfx broker alongside another provider, use the fee schedule and symbol specifications for the accounts you would actually trade. Compare their spreads at matching times and calculate commissions at your intended position size. Check whether account documentation gives a starting spread, a typical spread, or another measure, since those figures answer different questions. For positions that regularly cross the daily cutoff, include the applicable financing terms in the comparison. A trade that closes before the cutoff and a trade held through it can have different cost profiles even on the same account.
Check what a fixed-spread account promises for the symbol
If an account advertises fixed spreads, read the terms for the pair and trading window you care about. Check whether the stated quote applies during market openings, closings, and exceptional conditions. Also check when the symbol is available and how each order type is handled. A fixed quote width can help with cost estimates during the hours covered by the terms. Execution still depends on whether the instrument is tradable, how the order is handled, and which price is available when it fills.
With a variable-spread account, look at how often the quote sits in your acceptable range and how long it typically takes to return there after a disruption. A brief, infrequent spike and a predictable period of expensive quotes can have different effects on a strategy. If you only enter trades well away from the daily break, the overnight peak may matter primarily for positions you carry through it. If your strategy actively places or triggers orders during that window, quote availability and the spread during those minutes deserve more weight.
How to Make a Forex Backtest Account for Overnight Spreads
Check what the historical data actually contains
A strategy tested on one stream of candle prices can look more profitable than it would have been if it traded at the bid and ask available at the time. If the data contains only the bid, a backtest that also uses that price for purchases will understate the purchase cost whenever the ask is higher. If the data contains only the midpoint, the test needs a model for both the buy and sell prices. Check whether the file contains both sides of the quote, a single price stream, or a spread value attached to each record.
For strategies that can enter and exit inside the same candle, the order of price changes can matter as much as their range. A one-minute candle gives you an open, high, low, and close for the price stream it represents. It may leave you unable to determine whether an entry or exit condition occurred first. If both events could have happened within the same minute, use finer data when possible or document the assumption your test uses to resolve the sequence. This is especially relevant when a short-lived spread expansion could affect an order on the ask while the visible candle represents the bid.
Model trading windows and costs explicitly
If historical bid and ask ticks are available, model purchases and sales using the appropriate side of the quote and apply the platform’s trigger rules. If you only have candle data, test several spread assumptions based on the quotes you have observed for the relevant windows. You might use a baseline for active hours and a wider range around the daily transition. Report these results as scenarios. They show how the strategy behaves under the cost assumptions you chose and give you a way to see whether a result depends on unusually favorable pricing.
For example, suppose a backtest reports an average result of 1.4 pips per trade before a more realistic overnight cost is included. If your rollover scenario adds 2.0 pips to each trade that occurs in that window, those trades need a sufficiently large gross result to absorb the extra cost. Calculate the result for that subset separately. An overall average can conceal losses concentrated in overnight trades, particularly if daytime trades account for most of the sample.
Model scheduled breaks as periods when orders cannot fill if that matches the account’s rules. When testing a pending order through a break, use the first eligible quote after trading resumes and the documented execution terms. Also include applicable commissions and financing where the test has enough data to do so. Spread assumptions can explain part of the difference between simulated results and live results. Trading availability, financing, and fill assumptions can each affect the same trade.
Frequently Asked Questions
What time do forex spreads usually widen at night?
A common time to check is around 5 p.m. New York time, near the daily rollover used by some retail forex brokers. Spreads can change before or after that reference point, and individual symbols may have their own trading breaks. Convert the broker’s schedule for the date you are reviewing. Daylight saving time can shift the equivalent hour in your local time zone.
How long do forex spreads stay wide after rollover?
The duration varies by currency pair, broker, and market conditions. To estimate it for your account, compare the spread before rollover with timestamped quotes after trading resumes. Define recovery using a range you can apply consistently, such as the spread returning to its usual range for the following session. If you only have intermittent screenshots, they can confirm when you observed a wide spread and when you next observed a narrower one.
Can a forex spread widen when the chart barely moves?
Yes. A midpoint chart can stay flat if the bid falls and the ask rises by the same amount. A bid-only chart can also look steady while the ask moves higher. Check both prices from the same timestamp when the chart appears stable but the displayed spread increases. That comparison shows which side of the quote changed and by how much.
Can a wider forex spread trigger a stop-loss order?
Yes. If the platform uses the bid to trigger a stop on a long position, a falling bid can reach the stop during a spread expansion. If it uses the ask to trigger a stop on a short position, a rising ask can do the same. Review the platform’s trigger rules and the historical quote for the relevant side. Compare the trigger with the actual fill as a separate step.
Are forex spreads usually tighter during the London–New York overlap?
The overlap is a useful window to sample when evaluating spreads on pairs such as EUR/USD and GBP/USD. Compare your own observations from that window with quotes from rollover using the same account and symbol. Scheduled economic releases and other fast-moving events can widen quotes during active trading hours, so mark those events when interpreting the comparison.
Do I pay an overnight spread fee just for holding a forex position?
A wider spread changes the prices available to buy or sell and may affect the displayed value of an open position. If you transact while the quote is wide, the relevant bid or ask affects the price you receive. Any debit or credit for carrying an eligible position past the broker’s cutoff is an overnight financing adjustment. Check the trade fills and the financing entries in your statement to see how each affected your result.
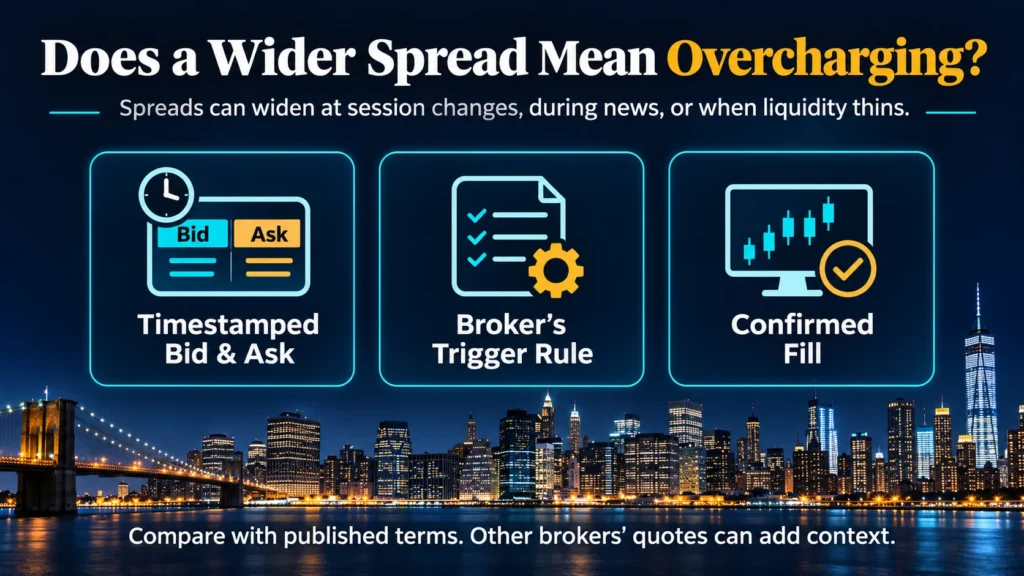
Does a wider spread at night mean my forex broker is overcharging?
Spread widening can occur around session boundaries, scheduled news, and periods of reduced liquidity. To assess a specific charge or execution, compare the account’s timestamped quote with its published pricing and execution terms. Quotes from other providers at the same instant can give you additional context. For an individual order, the strongest records are the relevant bid or ask, the broker’s trigger rule, and the confirmed fill.